Hide Comments
Hide Comments

Point Charts, Scatter Charts, & Bubble Charts

Comments (0)


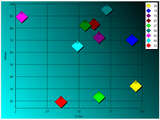
Point Charts shows chart values as a series of points.  Point Chart values share the same Height, Width, and Style.  
Point Charts shows chart values as a series of points.  Point Chart values share the same Height, Width, and Style.
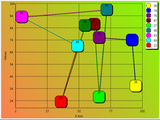
Point Chart Values can be connected by lines.
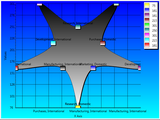
Scatter Charts are specialized point charts that can have the points optionally connected by a line style and filled in.
 Scatter Charts are connected in the order they are in the chart.  Here the points are connected only by lines and the area is not filled in.
 Scatter Charts are connected in the order they are in the chart.  Here the points are connected only by lines and the area is not filled in.
Bubble Charts resize the bubble sizes based on the largest bubble size in the chart.
Bubble Chart Sizes can be interpreted by the bubble chart as an area (default) or as a diameter. 


Comments (0)

RiverSoftAVG Charting Component Suite (RCCS) © 2005-2015, Thomas G. Grubb