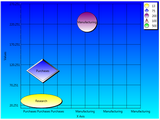
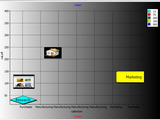
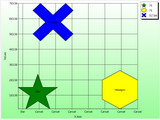
 | | Shape Charts allow each chart value to have its own shape and size. |
|
 | | Shape Charts can use images from a TImageList in VCL their shapes. |
|
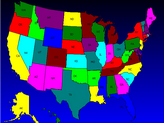
 | | Path Charts allow every chart value to be a path. Here there are 50 chart values, each with a location and a path describing the boundaries of the state. |
|
 | | Path Charts support robust path definitions (greater than what Delphi supports out of the box). |
|