|
Name
|
Description
|

|
TRSChartDataLink
|
Provides a data-aware link for the TRSChart and its descendants. Since this data link is being used in multiple descendants, it does most of the work so that little extra code is written in each chart type. The events are for unexpected uses.
 Note Note
|
DataFields holds the field names associated with each *dimension* in the TRSChartValue internal array PLUS one. The last index holds the Caption's FieldName
|
 Notes to Callers Notes to Callers
|
Data-aware charts use the TRSChartDataLink to provide a mapping of data field names to their Values dimension. They should expose properties that allow the user to input dataset field names for each dimension of their TRSChartValue.Values property. These field names would be placed in DataFields property.
|
|
|
TRSChartValuesCrack
|
Represents type TRSChartValuesCrack.
|
|
TRSDBAreaChart
|
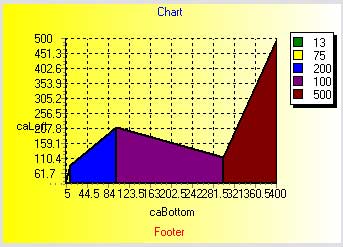
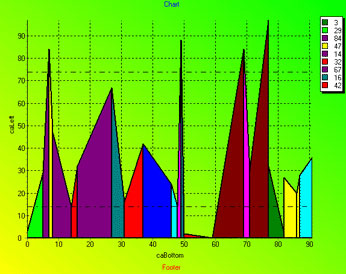
The TRSDBAreaChart component is the database aware version of the TRSAreaChart . The TRSDBAreaChart component represents a line chart ( TRSCustomLineChart ) where the area under the lines is also filled in. The Area Chart connects chart values ( TRS2DChartValue) by drawing a line between the points and filling in the area underneath the line to bottom axis of the chart panel.
The values for the chart are created by reading a dataset (database table or query) specified with the DataSource property. Each record in the dataset provides one value for the chart, where the DataFieldX property specifies the field to use for the X property of the Value and the DataFieldY property specifies the Y property of the Value.
|
|
TRSDBArrowChart
|
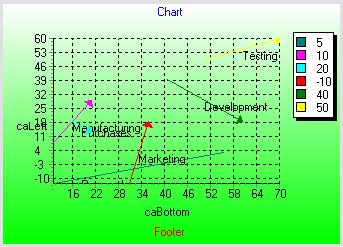
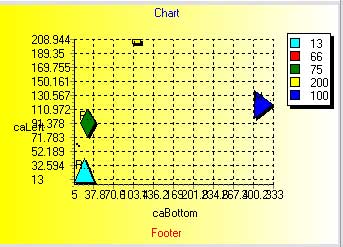
The TRSDBArrowChart component is the database aware version of the TRSArrowChart . The TRSArrowChart component is a TRSChart descendant where each value in the chart represents one arrow. The Arrow Chart displays each chart value ( TRSArrowChartValue ) as an arrow connecting the end points defined for the value.
The values for the chart are created by reading a dataset (database table or query) specified with the DataSource property. Each record in the dataset provides one value for the chart, where the DataFieldX property specifies the field to use for the X property of the Value, the DataFieldY property specifies the Y property of the Value, etc.
|
|
TRSDBBarChart
|
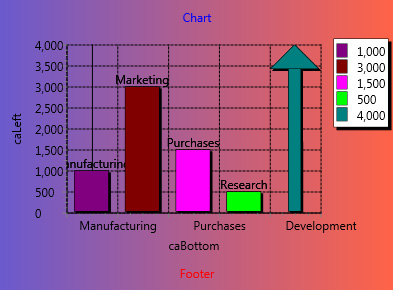
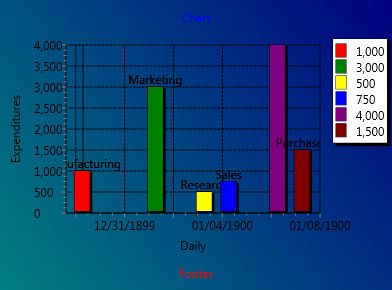
The TRSDBBarChart component is the database aware version of the TRSBarChart . The TRSBarChart component is a TRSCustomBarChart descendant that represents a bar chart. The Bar Chart displays each chart value ( TRSBarChartValue ) by as a vertical or horizontal bar (depending on Orientation). Each value draws a separate bar and the order of the bars is based on the order of the TRSBarChartValue in the collection.
The values for the chart are created by reading a dataset (database table or query) specified with the DataSource property. Each record in the dataset provides one value for the chart, where the DataField property specifies the field to use for the bar value.
|
|
TRSDBBubbleChart
|
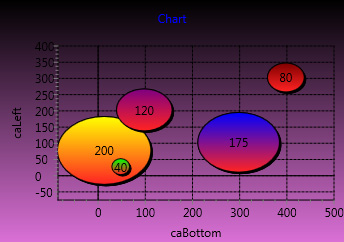
The TRSDBBubbleChart component is the database aware version of the TRSBubbleChart . Each chart value ( TRSBubbleChartValue ) is displayed as one bubble in the bubble chart. The size of the bubbles can represent the area of the bubbles or the diameter of the bubble (controlled by the SizeOption property of TRSBubbleChartValues), which affects the relative size of one bubble to another
The values for the chart are created by reading a dataset (database table or query) specified with the DataSource property. Each record in the dataset provides one value for the chart, where the DataFieldX property specifies the field to use for the X property of the Value and the DataFieldY property specifies the Y property of the Value.
|
|
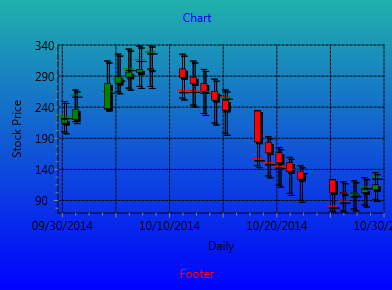
TRSDBCandleStickChart
|
The TRSDBCandleStickChart component is the database aware version of the TRSCandleStickChart. The TRSCandleStickChart component is a TRSHighLowAverageChart descendant that represents a candlestick chart. The CandleStick Chart displays each chart value ( TRSCandleStickChartValue ) as a vertical or horizontal candlestick (depending on Orientation).
The values for the chart are created by reading a dataset (database table or query) specified with the DataSource property. Each record in the dataset provides one value for the chart, where the DataFieldX property specifies the field to use for the X value, DataFieldClose specifies the field to use for the Close value, etc.
|
|
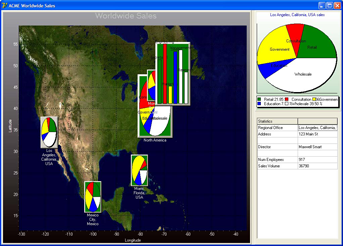
TRSDBChartInChart
|
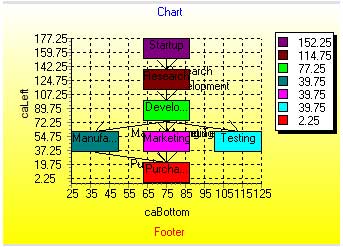
The TRSDBChartInChartChart component is the database aware version of the TRSChartInChart. The TRSChartInChart component is a TRSCustomShapeChart descendant where every value represents a chart inside a chart (similar to Picture-in-picture). The chart-in-chart displays chart values ( TRSChartInChartValue ) as charts where each point can be its own chart (e.g., the point can be a pie chart, a bar chart, etc). Each point has its own shape and size as well as sub-chart. Only one-subchart per value is allowed, though multiple values are permitted.
The values for the chart are created by reading a dataset (database table or query) specified with the DataSource property. Each record in the dataset provides one value for the chart, where the DataFieldX property specifies the field to use for the X property of the Value, the DataFieldY property specifies the Y property of the Value, etc.
|
|
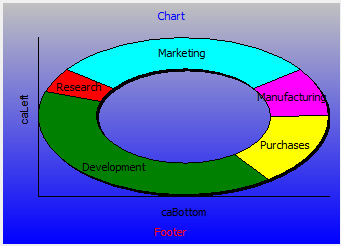
TRSDBDonutChart
|
The TRSDBDonutChart component is the database aware version of the TRSDonutChart . The TRSDonutChart component is a TRSCustomChart descendant that represents a donut chart. The Donut Chart displays each chart value ( TRSDonutChartValue) as a slice of the ring in the ring chart. The size of the slice is dependant on all the other slices in the donut chart, e.g., the size of a slice is proportional to the percentage that the donut slice's value is to the sum of all slices. The donut chart draws each slice starting from 3 o'clock position on a clock and goes counter-clockwise from there. Modify the Offset angle to change the starting angle.
The values for the chart are created by reading a dataset (database table or query) specified with the DataSource property. Each record in the dataset provides one value for the chart, where the DataField property specifies the field to use for the Value property of the Slice Value.
|
|
TRSDBDonutChartEx
|
The TRSDBDonutChartEx component is the database aware version of the TRSDonutChartEx. The TRSDonutChartEx component is a TRSCustomChart descendant that represents a donut chart. Unlike the normal Donut Chart ( TRSDonutChart ), the TRSDonutChartEx allows full control of donut pieces (OuterRadius, InnerRadius, StartAngle, Sweep Angle) at the cost of extra bookkeeping for the user, i.e., the TRSDonutChartEx does not track the percentage that each donut piece takes in the entire donut chart.
The values for the chart are created by reading a dataset (database table or query) specified with the DataSource property. Each record in the dataset provides one value for the chart, where the DataFieldStartAngle property specifies the field to use for the StartAngle property, DatatFieldSweepAngle specifies the field to use for the SweepAngle, etc.
|
|
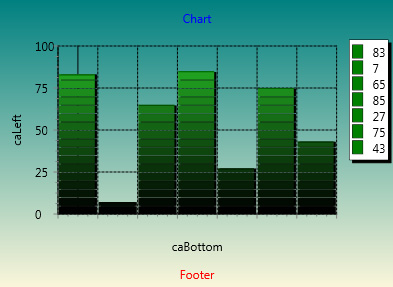
TRSDBEQChart
|
The TRSDBEQChart component is the database aware version of the TRSEQChart . The TRSEQChart component is a TRSChart descendant that provides an "equalizer" visualization. The TRSEQChart is similar to a bar chart ( TRSBarChart ) where every bar is made up of blocks and there are high water marks for each bar (think of a music equalizer). The EQ Chart displays each chart value ( TRSEQChartValue ) by as a vertical or horizontal bar (depending on Orientation), broken up into equal size blocks (except possibly the last block). Each value draws a separate bar and the order of the bars is based on the order of the TRSEQChartValue in the collection.
The values for the chart are created by reading a dataset (database table or query) specified with the DataSource property. Each record in the dataset provides one value for the chart, where the DataFieldValue property specifies the field to use for the Value property of the Value and the DataFieldHigh property specifies the High property of the Value.
|
|
TRSDBGraphChart
|
The TRSGraphChart component is a TRSShapeChart descendant that provides a visual representation of a graph or network with nodes and links between them, similar to a flow chart or org chart. The Graph Chart connects chart values ( TRSGraphChartValue ) by drawing an arrow representing the link ( TRSGraphChartLink ) between the shapes.
The values for the chart are created by reading a dataset (database table or query) specified with the DataSource property. Each record in the dataset provides one value for the chart, where the DataFieldX property specifies the field to use for the X property of the Value, the DataFieldY property specifies the Y property of the Value, etc.
|
|
TRSDBGuideChart
|
The TRSGuideChart component is a TRSCustomChart descendant that represents guides. Guides are horizontal or vertical lines, similar to Photoshop guides, that help the user more quickly see other chart values. A guide chart is meant to be used with other chart types to help users interpret the values. For example, you could create a horizontal guide at Y=100, which would display a horizontal line across the chart panel at Y=100. The user can then use this guide to see at a glance which values from a line chart are above or below 100.
The values for the chart are created by reading a dataset (database table or query) specified with the DataSource property. Each record in the dataset provides one value for the chart, where the DataFieldX property specifies the field to use for the X property of the Value and the DataFieldY property specifies the Y property of the Value.
|
|
TRSDBHighLowAverageChart
|
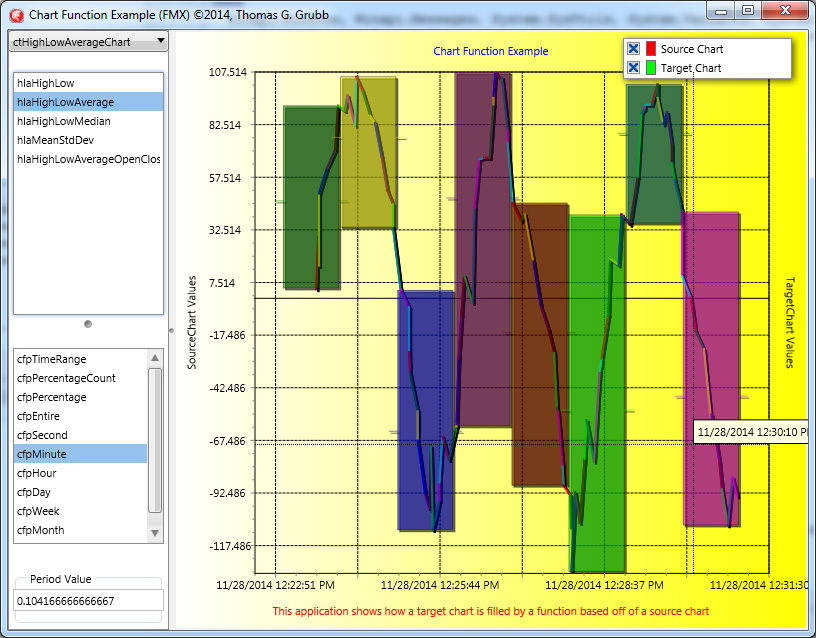
The TRSDBHighLowAverageChart component is the database aware version of the TRSHighLowAverageChart. The TRSHighLowAverageChart component is a TRSCustomSparseBarChart descendant that represents a high/low/average bar chart, i.e., bars that can show a vertical range. The High/Low/Average Bar Chart displays each chart value ( TRSHighLowAverageChartValue ) as a vertical or horizontal bar (depending on Orientation). A HighLowAverage chart is something like a combination of a line-chart and a bar-chart: each bar represents three important pieces of information: the Average (as line on side of bar), and the high and the low. Each value draws a separate bar and the order of the bars is based on the order of the TRSHighLowAverageChartValue in the collection.
The values for the chart are created by reading a dataset (database table or query) specified with the DataSource property. Each record in the dataset provides one value for the chart, where the DataFieldX property specifies the field to use for the X value, DataFieldClose specifies the field to use for the Close value, etc.
|
|
TRSDBLineChart
|
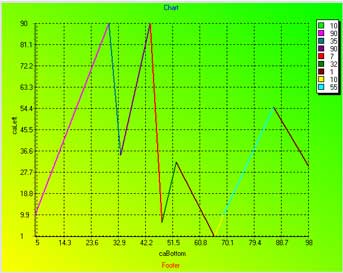
The TRSDBLineChart component is the database aware version of the TRSLineChart . The TRSLineChart component is a TRSCustomChart descendant that represents a line chart (it descends from the TRSCustomLineChart component). The Line Chart connects chart values ( TRS2DChartValue ) by drawing a line between the points.
The values for the chart are created by reading a dataset (database table or query) specified with the DataSource property. Each record in the dataset provides one value for the chart, where the DataFieldX property specifies the field to use for the X property of the Value and the DataFieldY property specifies the Y property of the Value.
|
|
TRSDBPathChart
|
The TRSDBPathChart component is the database aware version of the TRSPathChart . The TRSPathChart component is a TRSCustomChart descendant that represents a path chart. The path chart displays chart values ( TRSPathChartValue) as irregular shapes defined by paths representing groups of connected curves and lines. Every value in the chart has its own path and maintains the coordinates of geometric shapes in world coordinate space in an array of path points. Each saved point has a specific type, to identify the primitive shape it is defining. Complex shapes of a TPathData are composed of a sequence of primitive shapes like lines and curves.
The values for the chart are created by reading a dataset (database table or query) specified with the DataSource property. Each record in the dataset provides one value for the chart, where the DataFieldX property specifies the field to use for the X property of the Value, the DataFieldY property specifies the Y property of the Value, etc.
 Important Note Important Note
|
Unlike other charts, the path chart fetches data from one record only and creates one value only; it is assumed that one field of the record will hold the entire path.
|
In addition to using code to define your path shape, each value has a Data property which accepts a string defining the shape. This string uses the same format as the TPath FMX component, which is also the same format as the paths defined in SVG files. To show SVG shapes, copy the paths to chart values.
|
|
TRSDBPieChart
|
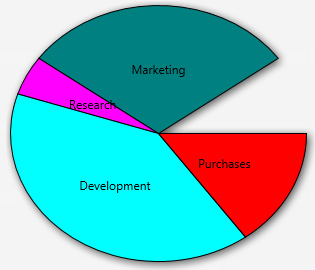
The TRSDBPieChart component is the database aware version of the TRSPieChart . The TRSPieChart component is a TRSCustomChart descendant that represents a pie chart. The Pie Chart displays each chart value ( TRSPieChartValue) as a slice of the pie in the pie chart. The size of the slice is dependant on all the other slices in the pie chart, e.g., the size of a slice is proportional to the percentage that the pie slice's value is to the sum of all slices. The pie chart draws each slice starting from 3 o'clock position on a clock and goes counter-clockwise from there. Modify the Offset angle to change the starting angle.
The values for the chart are created by reading a dataset (database table or query) specified with the DataSource property. Each record in the dataset provides one value for the chart, where the DataField property specifies the field to use for the Value property of the Slice Value.
|
|
TRSDBPointChart
|
The TRSDBPointChart component is the database aware version of the TRSPointChart . The TRSPointChart component is a TRSCustomChart descendant that represents a point chart. The point chart displays chart values ( TRS2DImageChartValue) as points, where all points are the same size and type of point (defined by the PointsInfo property). Use the TRSShapeChart component if you want each point to have individual shapes as well as size.
The values for the chart are created by reading a dataset (database table or query) specified with the DataSource property. Each record in the dataset provides one value for the chart, where the DataFieldX property specifies the field to use for the X property of the Value and the DataFieldY property specifies the Y property of the Value.
|
|
TRSDBScatterChart
|
The TRSDBScatterChart component is the database aware version of the TRSScatterChart. The TRSScatterChart component is a TRSCustomPointChart descendant that represents a scatter chart. The scatter chart displays chart values ( TRSScatterChartValue ) as scattered points which may optionally be connected by lines and filled in (see LineChartElements property).
The values for the chart are created by reading a dataset (database table or query) specified with the DataSource property. Each record in the dataset provides one value for the chart, where the DataFieldX property specifies the field to use for the X property of the Value and the DataFieldY property specifies the Y property of the Value.
|
|
TRSDBShapeChart
|
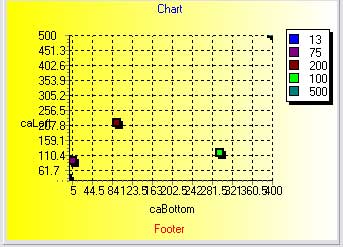
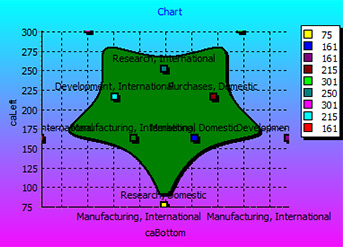
The TRSDBShapeChart component is the database aware version of the TRSShapeChart . The TRSShapeChart component is a TRSCustomShapeChart descendant that represents a shape chart. The shape chart displays chart values ( TRSShapeChartValue) as shapes where each point can have its own shape as well as size. If you want all points to be the same size and type of shape, use the RSDBCharts.TRSDBPointChart component.
The values for the chart are created by reading a dataset (database table or query) specified with the DataSource property. Each record in the dataset provides one value for the chart, where the DataFieldX property specifies the field to use for the X property of the Value, the DataFieldY property specifies the Y property of the Value, etc.
|
|
TRSDBSparseBarChart
|
The TRSDBSparseBarChart component is the database aware version of the TRSSparseBarChart. The TRSSparseBarChart component is a TRSCustomSparseBarChart descendant that represents a sparse bar chart, i.e., bars do not have to be besides each but spread through the horizontal axis . The Sparse Bar Chart displays each chart value ( TRSSparseBarChartValue ) by as a vertical or horizontal bar (depending on Orientation). Each value draws a separate bar and the order of the bars is based on the order of the TRSSparseBarChartValue in the collection.
The values for the chart are created by reading a dataset (database table or query) specified with the DataSource property. Each record in the dataset provides one value for the chart, where the DataFieldValue property specifies the field to use for the bar value, DataFieldX specifies the X location, etc.
|
|
TRSPathChartDataLink
|
Povide a data-aware link for the RSDBCharts.TRSDBPathChart .
Important Note
|
Unlike other charts, the path chart fetches data from one record only and creates one value only; it is assumed that one field of the record will hold the entire path.
|
Note
|
DataFields holds the field names associated with each *dimension* in the TRSChartValue internal array plus two. The last index holds the Caption's FieldName. The first index holds the path data
|
Notes to Callers
|
Data-aware path charts use the TRSPathChartDataLink to provide a mapping of data field names to their Values dimension. They should expose properties that allow the user to input dataset field names for each dimension of their TRSChartValue.Values property. These field names would be placed in DataFields property.
|
|
