
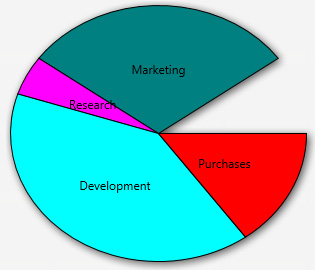
The TRSPieChart component is a RSChartPanel.TRSCustomChart descendant that represents a pie chart. The Pie Chart displays each chart value ( RSCharts.TRSPieChartValue) as a slice of the pie in the pie chart. The size of the slice is dependant on all the other slices in the pie chart, e.g., the size of a slice is proportional to the percentage that the pie slice's value is to the sum of all slices. The pie chart draws each slice starting from 3 o'clock position on a clock and goes counter-clockwise from there. Modify the Offset angle to change the starting angle.
Note that the pie chart always fills the rectangle between the axes on the chart panel, e.g., you cannot zoom in on a pie chart. You can, however, change the
OuterRadius property to shrink the pie chart and the
Origin property to move its center point.
Namespace: RSCharts

TGraphicControl |
Delphi |
type |
|
|


(Inherited from RSChartPanel.TRSCustomChart.) |
|||||||||||||||||||||||||||||||||||||||||||||||||||||||||||||||||||||||||||||||||||||||||||||||||||||||||||||||||||||||||||||||||||||||||||||||||||||||||||||||||||||||||||||||||||||||||||||||||||||||||||||||||||
|
Draw(TCanvas,TCanvasRect,TRSChartAxis,TRSChartAxis,Boolean,Boolean) |
Overloaded. Paints the chart to the specified Canvas in the specified location. The Draw Method uses the supplied TRSChartAxis (instead of the HorizontalAxis and VerticalAxis properties) to convert the chart values into pixel coordinates. Unlike the regular Draw method, this method draws the axes as well (useful for when the chart is not connected to a panel). Use the Draw method to paint the chart to any canvas and anywhere and with any size on the canvas. |


(Inherited from RSChartPanel.TRSCustomChart.)

DrawAxes(TCanvas,TCanvasRect,TRSChartAxis,TRSChartAxis)
Draws the specified axes to the Canvas (Inherited from RSChartPanel.TRSCustomChart.)
DrawGlyph(TCanvas,TCanvasRect)
Overloaded. Represents method DrawGlyph(TCanvas,TCanvasRect). (Inherited from RSChartPanel.TRSCustomChart.)
DrawGlyph(TCanvas,TRSChartValue,TCanvasRect)
Overloaded. Represents method DrawGlyph(TCanvas,TRSChartValue,TCanvasRect). (Inherited from RSChartPanel.TRSCustomChart.)

Calls the OnDrawing event and returns True if the draw process should continue.
This method is called before the InternalDraw method.
DrawLabel(TCanvas,String,TCanvasPixel,TCanvasPixel,Single)
Overloaded. Draws the text caption centered above the X, Y point without clipping.
|
|---|
The Opacity is ignored in VCL |
DrawLabel(TCanvas,String,TCanvasRect,Single)
Overloaded. Draws the text caption centered within the rectangle. The text is clipped
|
|---|
The Opacity is ignored in VCL |
DrawLabel(TCanvas,TRSChartValue,TCanvasPixel,TCanvasPixel)
Overloaded. Draws the text caption centered above the X, Y point without clipping.
|
|---|
The Opacity is specified by the RSChartPanel.TRSChartValue.Opacity property |
DrawLabel(TCanvas,TRSChartValue,TCanvasRect)
Overloaded. Draws a label for the TRSChartValue on the canvas. The text of the label is controlled by the ValueLabelStyle property.
The label is drawn within the specified rectangle.
|
|---|
The Opacity is specified by the RSChartPanel.TRSChartValue.Opacity property |
Calls the OnDraw event.
This method is called after the InternalDraw method.
DrawPieSlice(TCanvas,TCanvasRect,Double,Double,TRSPieChartValue,TPieSliceOptions)
Draw One Pie Slice
DrawSlices(TCanvas,TCanvasRect,TPieSliceOptions)
Draw all the pie slices of the chart
Re-enables screen repainting and change events. Use EndUpdate to re-enable screen repainting and change events that were turned off with the BeginUpdate method. (Inherited from RSChartPanel.TRSCustomChart.)
FormatValue(TRSChartValue,TRSLabelTextStyle)
Generates a label for the Value based on the TextStyle (Inherited from RSChartPanel.TRSCustomChart.)
Returns the vertical offset ( OffsetVertical).
If coUseVerticalOffset is not in Options, this method always returns 0. If coUseVerticalOffset is in Options, the function returns the OffsetVertical value.
GetAxisCaption(TRSChartAxis,Integer,TRSChartValueType)
Returns a label for an axis ( RSChartPanel.TRSChartAxis ) based on the input Value. The Index specifies where to start looking in the chart Values (for optimization purposes) and decrements from there until the closest chart value is found. (Inherited from RSChartPanel.TRSCustomChart.)

Returns the chart type enumerated value for this class. Each chart class overrides this class function to return the RSChartConsts|TRSChartType enumerated value (Overrides RSChartPanel.TRSCustomChart.GetChartType.)
Overloaded. Represents method GetColor. (Inherited from RSChartPanel.TRSCustomChart.)
Overloaded. Returns the color of the chart value. The color of the TRSChartValue can change depending on the Options property as well as any other chart states (e.g., the TRSCandleStickChart class overrides this method to turn the color red or green depending on if the Open value is greater than the Closing Value) (Inherited from RSChartPanel.TRSCustomChart.)
GetCumulativeTotal(Integer,Integer,TRSCustomChartClass)
Determine the cumulative value at this index for all charts in the Group. The ValIndex specifies the TRSChartValue.Values dimension to compare.
Used for stacking charts.
GetCumulativeValue(Integer,Integer,TRSCustomChartClass)
Determine the cumulative value at this index for all charts below (spatially) this chart in the same Group. The ValIndex specifies the TRSChartValue.Values dimension to compare.
Used for stacking charts.
Represents method GetGroupDimension. (Inherited from RSChartPanel.TRSCustomChart.)
GetRadius(TRSPieChartValue,Single,Single)
Returns the InnerRadius and OuterRadius of the pie chart
GetSlicePath(TCanvasRect,TRSPieChartValue)
Returns the path data for drawing that pie chart value
Returns a new chart color based on the ChartColorScheme and ChartColorList. Every time a chart is created, it is assigned a new color from the current ChartColorList. (Inherited from RSChartPanel.TRSCustomChart.)
Initialize the OnChange events of structures. Use this method to assign event handlers for structures (e.g., Pen.OnChange := MyChangeMethod).
|
|---|
The constructor calls this method after it calls the InitializeChart method, which is where the structures should be actually created and initialized. |
Creates and initialize structures and values of chart. This method is the safe place to initialize chart values without change events occurring.
|
|---|
The constructor calls this method. Use this method to actually create and initialize properties. Do not assign event properties in this method (use the InitializeChangeEvents method instead) |
InternalDraw(TCanvas,TCanvasRect)
Overloaded. Paints the chart graphic to the specified canvas at the specified rectangle. The InternalDraw method is called by the Draw method.
Descendant classes of TRSCustomChart override the InternalDraw method to actually paint themselves.
|
|---|
The default InternalDraw method implementation assigns the Brush, Pen , and Font to the Canvas. |
InternalSelect(TCanvasRect,TRSChartSelectionAction)
Selects or deselects chart Values ( RSChartPanel.TRSChartValue ) based on whether they intersect with the selection rectangle (which is in pixel coordinates).
The base method converts the SelectionRect to chart coordinates (based on HorizontalAxis and VerticalAxis) and then selects values based on the TRSChartValue.Selectable method
Returns True if any value in the chart intersects with the SelectionRect (Overrides RSChartPanel.TRSCustomChart.IsSelectable(TCanvasRect).)
Represents method IsValuesStored. (Inherited from RSChartPanel.TRSCustomChart.)
Indicates whether the chart is visible. A chart is visible if its Visible property is True and both axes have been assigned. (Inherited from RSChartPanel.TRSCustomChart.)
Represents method Loaded. (Inherited from RSChartPanel.TRSCustomChart.)
Represents method MouseHover(TCanvasRect). (Inherited from RSChartPanel.TRSCustomChart.)
Notification(TComponent,TOperation)
Represents method Notification(TComponent,TOperation). (Inherited from RSChartPanel.TRSCustomChart.)
Represents method Paint. (Inherited from RSChartPanel.TRSCustomChart.)
Represents method PanelChanged. (Inherited from RSChartPanel.TRSCustomChart.)
Represents method RSVisibleChanged. (Inherited from RSChartPanel.TRSCustomChart.)
SaveCanvasResources(TCanvas,TBrush,TRSPen,TFont)
Represents method SaveCanvasResources(TCanvas,TBrush,TRSPen,TFont). (Inherited from RSChartPanel.TRSCustomChart.)
Select(TCanvasRect,TRSChartSelectionAction)
Selects or deselects chart Values ( RSChartPanel.TRSChartValue ) based on whether they intersect with the selection rectangle (which is in pixel coordinates).
The base method converts the SelectionRect to chart coordinates (based on HorizontalAxis and VerticalAxis) and then selects values based on the TRSChartValue.Selectable method
|
|---|
Descendant classes override the InternalSelect method |
Represents method SelectionColorChanged. (Inherited from RSChartPanel.TRSCustomChart.)
Overloaded. Represents method SenderChanged(TObject). (Inherited from RSChartPanel.TRSCustomChart.)
SetCanvasResources(TCanvas,TBrush,TRSPen,TFont,Boolean,Boolean)
Overloaded. Represents method SetCanvasResources(TCanvas,TBrush,TRSPen,TFont,Boolean,Boolean). (Inherited from RSChartPanel.TRSCustomChart.)
SetCanvasResources(TCanvas,TRSChartValue,Boolean,Boolean)
Overloaded. Represents method SetCanvasResources(TCanvas,TRSChartValue,Boolean,Boolean). (Inherited from RSChartPanel.TRSCustomChart.)
Represents method SetColor(TCanvasColor). (Inherited from RSChartPanel.TRSCustomChart.)
Represents method SetOptions(TChartOptions). (Overrides RSChartPanel.TRSCustomChart.SetOptions(TChartOptions).)
Represents method UpdateAxisInfo(TRSChartAxis). (Inherited from RSChartPanel.TRSCustomChart.)
Updates the values to the current color scheme. If PanelColorScheme is True then uses the Panel's color scheme (Inherited from RSChartPanel.TRSCustomChart.)
ValueSelectionChanged(TRSChartValue)
Represents method ValueSelectionChanged(TRSChartValue). (Inherited from RSChartPanel.TRSCustomChart.)
ValueVisibleChanged(TRSChartValue)
Represents method ValueVisibleChanged(TRSChartValue). (Inherited from RSChartPanel.TRSCustomChart.)
Returns true if the chart prefers Captions over Values for its labels on the input Axis. This method provides a hint to the TRSChartAxis when LabelStyle is alsAutomatic. (Inherited from RSChartPanel.TRSCustomChart.)
|

If you want more control over your pie slices, use the TRSDonutChartEx component. |
To display a chart, you drop the component on a form and optionally connect its Panel property to the RSChartPanel.TRSChartPanel component where you want it to be displayed. The Values property is the most important property of the chart type and allows you to define the chart values at design-time or run-time. For the Pie Chart, the Values property contains TRSPieChartValue collection items which define the amount of the slice. To display a pie chart inside a chart panel: • Drop a TRSPieChart component on a form • Drop a TRSChartPanel component where you want the chart to be displayed. (Note, more than one chart can share the same chart panel) • Connect the Panel property of the chart to the chart panel |
To add a pie slice to the chart (at Design-Time):
• Select the TRSPieChart component • Click the ellipsis button (...) for the Values property of the chart. This action displays Delphi's Collection Editor for the TRSPieChartValues collection. • Use the Add button to add pie slices (TRSPieChartValue collection item) to the chart. • Edit the Value property for the pie slice. Note that the size of the slice is dependant on the value's proportion of the sum of all pie slice values |
To add a pie slice to the chart (at Run-Time):
Delphi |
|---|
var |
Reference•TRSDBPieChart •TRSDonutChartEx |
