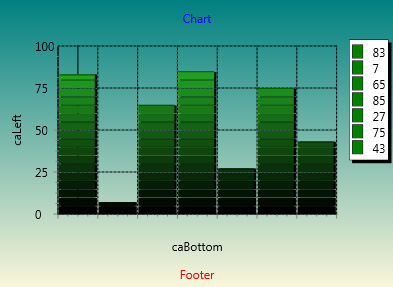
The TRSDBEQChart component is the database aware version of the TRSEQChart . The TRSEQChart component is a TRSChart descendant that provides an "equalizer" visualization. The TRSEQChart is similar to a bar chart ( TRSBarChart ) where every bar is made up of blocks and there are high water marks for each bar (think of a music equalizer). The EQ Chart displays each chart value ( TRSEQChartValue ) by as a vertical or horizontal bar (depending on Orientation), broken up into equal size blocks (except possibly the last block). Each value draws a separate bar and the order of the bars is based on the order of the TRSEQChartValue in the collection.
The values for the chart are created by reading a dataset (database table or query) specified with the
DataSource property. Each record in the dataset provides one value for the chart, where the DataFieldValue property specifies the field to use for the Value property of the Value and the DataFieldHigh property specifies the High property of the Value.
Namespace: RSDBCharts
TRSEQChart
RSDBCharts.TRSDBEQChart
|
Delphi
|
type
TRSDBEQChart = class(TRSEQChart)
end;
|
|
Name
|
Description
|

|
DataFieldCaption
|
Specifies the field name whose value is used for the Caption property of the data-aware chart values. Use DataFieldCaption to bind each data-aware chart value to a field object in the dataset. To fully specify a database field, both the dataset and the field within the dataset must be defined. The DataSource property of the chart specifies the dataset that contains the data field.
Use the other DataFieldXXX properties to specify the field names for other properties of the chart value (e.g., DataFieldX specifies the field for the X property of the value). For chart value properties that don't have a corresponding DataFieldXXX property, you can use the OnGetChartValue event to change their values.
|
|
DataFieldHigh
|
Specifies the field name whose value is used for the High property of the data-aware chart values. Use DataFieldHigh to bind each data-aware chart value to a field object in the dataset. To fully specify a database field, both the dataset and the field within the dataset must be defined. The DataSource property of the chart specifies the dataset that contains the data field. The field object needs to be convertable to a floating-point value.
Use the other DataFieldXXX properties to specify the field names for other properties of the chart value (e.g., DataFieldCaption specifies the field for the Caption property of the value). For chart value properties that don't have a corresponding DataFieldXXX property, you can use the OnGetChartValue event to change their values.
|
|
DataFieldValue
|
Specifies the field name whose value is used for the Value property of the data-aware chart values. Use DataFieldValue to bind each data-aware chart value to a field object in the dataset. To fully specify a database field, both the dataset and the field within the dataset must be defined. The DataSource property of the chart specifies the dataset that contains the data field. The field object needs to be convertable to a floating-point value.
Use the other DataFieldXXX properties to specify the field names for other properties of the chart value (e.g., DataFieldCaption specifies the field for the Caption property of the value). For chart value properties that don't have a corresponding DataFieldXXX property, you can use the OnGetChartValue event to change their values.
|

|
DataLink
|
Returns the data link that manages the mapping of chart values to field values
|
|
DataSource
|
Identifies the link to the dataset where the data-aware chart finds its data. Use the DataSource property to set the TDataSource object where the data-aware chart should fetch its data. Each record of the dataset corresponds to one chart value item in the chart's collection.
The DataFieldXXX properties specifies which TField objects of the dataset are used to populate the corresponding properties in the chart value. Any chart value property that doesn't have a TField linked to it uses its defaults. However, you can use the OnGetChartValue event to change any aspect of a chart value after its field values have been fetched from the dataset.
|
|
OnGetChartValue
|
Occurs when the data-aware chart creates a new chart value based on the DataSource . For each record in the dataset, the data-aware chart creates a chart value, populates it based on DataFieldXXX fields and then call this event.
Write an OnGetChartValue event handler to take action when a chart value is created by a record, either to update other information based on the chart value or to modify a chart value for each record before they are displayed in the chart.
|
Top
|
To display a chart, you drop the component on a form and optionally connect its Panel property to the TRSChartPanel component where you want it to be displayed. Next, connect the DataSource property to the a TDataSource component on your form. Use the DataFieldXXX properties to connect a field to the corresponding XXX property of the chart value The following example links a dataset and some fields to the db-aware chart:
Delphi
|
begin
RSDBEQChart1.DataSource := DataSource1;
RSDBEQChart1.DataFieldValue := DataSource1.DataSet.FieldByName('LEVEL');
end;
|
|


