|
Name
|
Description
|

|
AsDateTime
|
Provides access to the Value property as a TDateTime value.
 Notes to Inheritors Notes to Inheritors
|
Usually this property provides access to the first dimension (X) of the value array. However, descendant classes can change which dimension this property accesses.
|
|
|
AsDateTimes[Integer]
|
Represents property AsDateTimes[Integer]. (Inherited from FMX.RS.ChartPanel.TRSChartValue.)
|
|
Caption
|
Provides a caption or description of the chart value. This value will only be drawn if coLabelEachPoint is in the chart's Options property. (Inherited from FMX.RS.ChartPanel.TRSChartValue.)
|
|
Collection
|
Specifies the RSCharts|TRSEQChartValues instance to
which this Item belongs. Each collection item belongs to the
collection which creates it. The Collection property
points to the collection object to which the value belongs.
|
|
Color
|
Specifies the color of this individual value, e.g., the color of the bar or the point or the shape. When coColorEachPoint is in the RSChartPanel|TRSCustomChart.Options property, this color is drawn by the chart. When coColorEachPoint is not in the the Options property, the Color of the chart is used. (Inherited from FMX.RS.ChartPanel.TRSChartValue.)
|
|
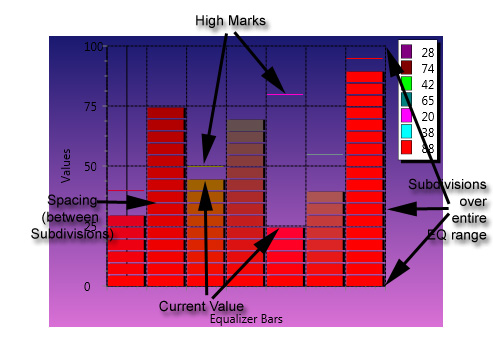
High
|
Returns the highest equalizer value this item has contained previously. In other words, if you have set the Value property to 10, 30, and 20 previously, the High property will return 30.
|
|
Opacity
|
Specifies the opacity of the value when drawn. The opacity is a value between 0 (invisible) and 1 (fully opaque). Any value in-between controls the transparency of the value.
 Important Note Important Note
|
This is an FMX only feature. Any value > 0 is drawn fully opaque in the VCL version
|
|

|
Options
|
Represents property Options. (Inherited from FMX.RS.ChartPanel.TRSChartValue.)
|
|
Scale
|
Specifies the scale factor for the value. A scale factor of 1 (default) draws the value at its normal size within the chart. Change the scale factor to shrink or grow the value within the chart (for drawing purposes only) (Inherited from FMX.RS.ChartPanel.TRSChartValue.)
|
|
Selected
|
Determines whether the chart value is selected. Use the Selected property to select or deselect a chart value. Selected chart values are displayed with the SelectionColor of the chart panel.
(Inherited from FMX.RS.ChartPanel.TRSChartValue.)
|
|
Tag
|
Provides user-defined storage that is associated with the value (Inherited from FMX.RS.ChartPanel.TRSChartValue.)
|
|
Value
|
Represents property Value.
|
|
ValueCount
|
Returns the number of dimensions in the chart value. A chart value, depending on the chart type, can contain 1 or more dimensional values that define the chart value.
For example, each chart value in a bar chart contains 1 value (defining the height of the bar), line chart values contains 2 dimensions: X and Y, and shape chart values contain 4 dimensions: X, Y, Width, and Height.
Use the Values property to access each dimension in the chart value. The Value property in comparison returns the main (or only) dimension in a chart value - which dimension is returned is based on the chart type.
Caution
|
Note that TRSChartValue descendant classes expose properties, such as X and Y, which are safer to access the specific dimension of the value. You should not count on a specific dimension index to contain a specific property
|
|
|
Values[Integer]
|
Returns the value for the dimension in the chart value. A chart value, depending on the chart type, can contain 1 or more dimensional values that define the chart value.
For example, each chart value in a bar chart contains 1 value (defining the height of the bar), line chart values contains 2 dimensions: X and Y, and shape chart values contain 4 dimensions: X, Y, Width, and Height.
Use the Values property to access each dimension in the chart value. The Value property in comparison returns the main (or only) dimension in a chart value - which dimension is returned is based on the chart type.
Caution
|
Note that TRSChartValue descendant classes expose properties, such as X and Y, which are safer to access the specific dimension of the value. You should not count on a specific dimension index to contain a specific property
|
The ValueCount will equal the DimensionCount of the collection.
|
|
Visible
|
Determines whether the chart value is visible or not. Use the Visible property to change the visibility of the chart value. Even if the Visible property is True, the chart value may still not be visible if the chart axis is zoomed. (Inherited from FMX.RS.ChartPanel.TRSChartValue.)
|
|
X
|
Provide access to the first dimension of the Values property. The X, Y, and Z properties provide access to the first three dimensions of the Values property.
Use the X, Y, and Z property to access the coordinates of a point.
Notes to Inheritors
|
These properties have protected visibility in the class, but descendant classes (e.g., RSCharts|TRS2DChartValue and TRS3DChartvalue ) publish the properties to provide more explanatory access to the dimensions of the Values property.
Remember to also publish the XAsDateTime, YAsDateTime, and ZAsDateTime properties
|
|
|
XAsDateTime
|
Provide access to the first dimension of the Values property. The X, Y, and Z properties provide access to the first three dimensions of the Values property.
Use the X, Y, and Z property to access the coordinates of a point.
Notes to Inheritors
|
These properties have protected visibility in the class, but descendant classes (e.g., RSCharts|TRS2DChartValue and TRS3DChartvalue ) publish the properties to provide more explanatory access to the dimensions of the Values property.
Remember to also publish the XAsDateTime, YAsDateTime, and ZAsDateTime properties
|
|
|
Y
|
Provide access to the second dimension of the Values property. The X, Y, and Z properties provide access to the first three dimensions of the Values property.
Use the X, Y, and Z property to access the coordinates of a point.
Notes to Inheritors
|
These properties have protected visibility in the class, but descendant classes (e.g., RSCharts|TRS2DChartValue and TRS3DChartvalue ) publish the properties to provide more explanatory access to the dimensions of the Values property.
Remember to also publish the XAsDateTime, YAsDateTime, and ZAsDateTime properties
|
|
|
YAsDateTime
|
Provide access to the second dimension of the Values property. The X, Y, and Z properties provide access to the first three dimensions of the Values property.
Use the X, Y, and Z property to access the coordinates of a point.
Notes to Inheritors
|
These properties have protected visibility in the class, but descendant classes (e.g., RSCharts|TRS2DChartValue and TRS3DChartvalue ) publish the properties to provide more explanatory access to the dimensions of the Values property.
Remember to also publish the XAsDateTime, YAsDateTime, and ZAsDateTime properties
|
|
|
Z
|
Provide access to the third dimension of the Values property formatted as a TDateTime. The XAsDateTime, YAsDateTime, and ZAsDateTime properties provide access to the first three dimensions of the Values property formatted as a TDateTime
Notes to Inheritors
|
These properties have protected visibility in the class, but descendant classes (e.g., RSCharts|TRS2DChartValue and TRS3DChartvalue ) publish the properties to provide more explanatory access to the dimensions of the Values property.
Remember to also publish the X, Y, and Z properties
|
|
|
ZAsDateTime
|
Provide access to the third dimension of the Values property. The X, Y, and Z properties provide access to the first three dimensions of the Values property.
Use the X, Y, and Z property to access the coordinates of a point.
Notes to Inheritors
|
These properties have protected visibility in the class, but descendant classes (e.g., RSCharts|TRS2DChartValue and TRS3DChartvalue ) publish the properties to provide more explanatory access to the dimensions of the Values property.
Remember to also publish the XAsDateTime, YAsDateTime, and ZAsDateTime properties
|
|
