|
Name
|
Description
|

|
TChartAxisHack
|
Represents type TChartAxisHack.
|
|
TRSBarChart
|
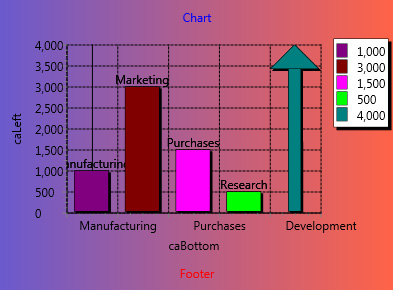
The TRSBarChart component is a RSBarCharts.TRSCustomBarChart descendant that represents a bar chart. The Bar Chart displays each chart value ( RSBarCharts.TRSBarChartValue ) by as a vertical or horizontal bar (depending on Orientation). Each value draws a separate bar and the order of the bars is based on the order of the TRSBarChartValue in the collection.
 Note Note
|
Charts are TGraphicControl descendants for VCL and TControl descendants for FMX. Display charts on a chart panel (with integrated axes, legend, header, footers, etc) or stand-alone (allowing use of FMX effects or embedding within other controls). Set the Panel property to the RSChartPanel.TRSChartPanel you want the chart displayed inside or nil for stand-alone use.
|
|
|
TRSBarChartValue
|
Extends the RSChartPanel.TRSChartValue class to provide the properties and methods needed to describe one bar of the RSBarCharts.TRSBarChart component. The TRSBarChartValue class uses the Value property to specify the height of the bar.
|
|
TRSBarChartValues
|
Defines the collection of all bars in a bar chart. A bar chart is made up of a collection of bars ( RSBarCharts.TRSBarChartValue ), where each TRSBarChartValue defines the information for one bar for the chart. The TRSBarChartValue class defines the common properties to all bars, including Caption, Color, and Values. The TRSBarChartValues collection defines the common properties to all bar values, such as DimensionCount, MaxValues, and MinValues.
Note that the TRSBarChartValues collection provides built-in support for limiting the number of values in the collection (using the Limit property).
|
|
TRSBarChartValuesEnumerator
|
Represents type TRSBarChartValuesEnumerator.
|
|
TRSCandleStickChart
|
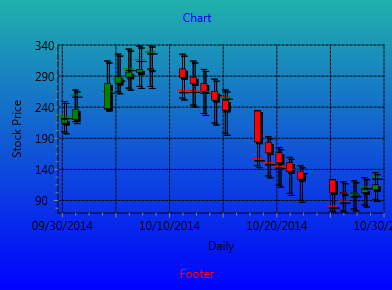
The TRSCandleStickChart component is a RSBarCharts.TRSHighLowAverageChart descendant that represents a candlestick chart. The CandleStick Chart displays each chart value ( RSBarCharts.TRSCandleStickChartValue ) as a vertical or horizontal candlestick (depending on Orientation).
A candlestick chart is a style of financial chart used to describe price movements of a security, derivative, or currency. Each "candlestick" typically shows one day; so for example a one month chart may show the 20 trading days as 20 "candlesticks". It is something like a combination of line-chart and a bar-chart: each bar represents all four important pieces of information for that day: the open, the close, the high and the low.
Each value draws a separate candlestick and the order of the candlesticks is based on the order of the TRSCandleStickChartValue in the collection.
The TRSCandleStickChartValue class uses the Value property to specify the height of each candlestick. The X property specifies where in the horizontal axis that candlestick is located. The UpShape property specifies the Bar Style and Brush/Pen to use when a candlestick closes higher than it opens. The DownShape property specifies the Bar Style and Brush/Pen to use when a candlestick closes lower than it opens.
Note
|
Charts are TGraphicControl descendants for VCL and TControl descendants for FMX. Display charts on a chart panel (with integrated axes, legend, header, footers, etc) or stand-alone (allowing use of FMX effects or embedding within other controls). Set the Panel property to the RSChartPanel.TRSChartPanel you want the chart displayed inside or nil for stand-alone use.
|
|
|
TRSCandleStickChartValue
|
Extends the RSBarCharts.TRSHighLowAverageChartValue class to provide the properties and methods needed to describe one candlestick of the RSBarCharts.TRSCandleStickChart component. Each bar represents all four important pieces of information for financial-type data: the open, the close, the high and the low, and the average.
Candlesticks are usually composed of the body, and an upper and a lower shadow (wick): the area between the open and the close is called the real body, price excursions above and below the real body are called shadows.
|
|
TRSCandleStickChartValues
|
Defines the collection of all candlesticks in a candlestick chart. A high/low/average bar chart is made up of a collection of bars ( RSBarCharts.TRSHighLowAverageChartValue ), where each TRSCandleStickChartValue defines the information for one candlestick for the chart. The TRSCandleStickChartValue class defines the common properties to all candlesticks, including X, Value, High, Low, Average, Open, Close, Caption, and Color. The TRSCandleStickChartValues collection defines the common properties to all bar candlesticks, such as DimensionCount, MaxValues, and MinValues.
Note that the TRSCandleStickChartValues collection provides built-in support for limiting the number of values in the collection (using the Limit property).
|
|
TRSCandleStickChartValuesEnumerator
|
Represents type TRSCandleStickChartValuesEnumerator.
|
|
TRSCandleStickGraphic
|
Extends the RSChartPanel.TRSChartGraphicArea class to define the Style, Brush, and Pen for candlestick shapes
|
|
TRSCustomBarChart
|
The TRSBarChart component is a RSChartPanel.TRSCustomChart descendant that represents a bar chart. The Bar Chart displays each chart value ( RSBarCharts.TRSBarChartValue) by as a vertical or horizontal bar (depending on Orientation). Each value draws a separate bar and the order of the bars is based on the order of the TRSBarChartValue in the collection.
Note
|
Charts are TGraphicControl descendants for VCL and TControl descendants for FMX. Display charts on a chart panel (with integrated axes, legend, header, footers, etc) or stand-alone (allowing use of FMX effects or embedding within other controls). Set the Panel property to the RSChartPanel.TRSChartPanel you want the chart displayed inside or nil for stand-alone use.
|
|
|
TRSCustomSparseBarChart
|
The TRSCustomSparseBarChart component is a RSBarCharts.TRSCustomBarChart descendant that represents a sparse bar chart, i.e., bars do not have to be besides each but spread through the horizontal axis . The Sparse Bar Chart displays each chart value ( RSBarCharts.TRSSparseBarChartValue ) by as a vertical or horizontal bar (depending on Orientation). Each value draws a separate bar and the order of the bars is based on the order of the TRSSparseBarChartValue in the collection.
The TRSSparseBarChartValue class uses the Value property to specify the height of each bar. The X property specifies where in the horizontal axis that bar is located.
Note
|
Charts are TGraphicControl descendants for VCL and TControl descendants for FMX. Display charts on a chart panel (with integrated axes, legend, header, footers, etc) or stand-alone (allowing use of FMX effects or embedding within other controls). Set the Panel property to the RSChartPanel.TRSChartPanel you want the chart displayed inside or nil for stand-alone use.
|
|
|
TRSEQChart
|
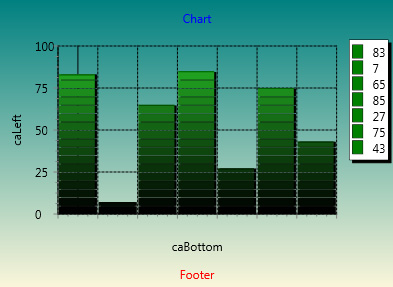
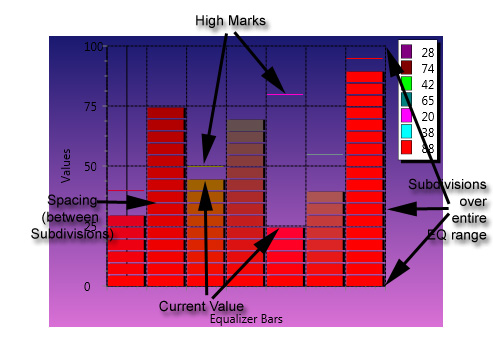
The TRSEQChart component is a RSCharts.TRSChart descendant that provides an "equalizer" visualization. The TRSEQChart is similar to a bar chart ( RSBarCharts.TRSBarChart ) where every bar is made up of blocks and there are high water marks for each bar (think of a music equalizer). The EQ Chart displays each chart value ( RSBarCharts.TRSEQChartValue ) by as a vertical or horizontal bar (depending on Orientation), broken up into equal size blocks (except possibly the last block). Each value draws a separate bar and the order of the bars is based on the order of the TRSEQChartValue in the collection
|
|
|
|
|
|
|
|
|
|
|
|
|
|
|
|
|
|
|
|
|
|
|
|
|
|
|
|
|
|
|
|
|
|
|
|
|
|
|
|
|
TRSEQChartValue
|
Defines one equalizer bar in the equalizer chart. Each EQ chart is made up of a collection of EQ bars ( RSBarCharts.TRSEQChartValues ), where each TRSEQChartValue descendant defines one EQ bar (or frequency) for the chart. The TRSEQChartValue class manages the frequency level (in the Value property) as well as the High value for the frequency.
|
|
TRSEQChartValues
|
Extends the RSChartPanel.TRSChartValues class to define the set of equalizer bars or frequencies that make up the equalizer chart. Each EQ chart is made up of a collection of EQ bars (TRSEQChartValues), where each RSBarCharts.TRSEQChartValue descendant defines one EQ bar (or frequency) for the chart. The TRSEQChartValue class manages the frequency level (in the Value property) as well as the High value for the frequency. The EQChartValues class is used by the RSBarCharts.TRSEQChart component.
Note that the TRSEQChartValues collection provides built-in support for limiting the number of values in the collection (using the Limit property).
|
|
TRSEQChartValuesEnumerator
|
Represents type TRSEQChartValuesEnumerator.
|
|
TRSHighLowAverageChart
|
The TRSHighLowAverageChart component is a RSBarCharts.TRSCustomSparseBarChart descendant that represents a high/low/average bar chart, i.e., bars that can show a vertical range. The High/Low/Average Bar Chart displays each chart value ( RSBarCharts.TRSHighLowAverageChartValue ) as a vertical or horizontal bar (depending on Orientation). A HighLowAverage chart is something like a combination of a line-chart and a bar-chart: each bar represents three important pieces of information: the Average (as line on side of bar), and the high and the low. Each value draws a separate bar and the order of the bars is based on the order of the TRSHighLowAverageChartValue in the collection.
The TRSHighLowAverageChartValue class uses the Value property to specify the height of each bar. The X property specifies where in the horizontal axis that bar is located.
Note
|
Charts are TGraphicControl descendants for VCL and TControl descendants for FMX. Display charts on a chart panel (with integrated axes, legend, header, footers, etc) or stand-alone (allowing use of FMX effects or embedding within other controls). Set the Panel property to the RSChartPanel.TRSChartPanel you want the chart displayed inside or nil for stand-alone use.
|
|
|
TRSHighLowAverageChartFunction
|
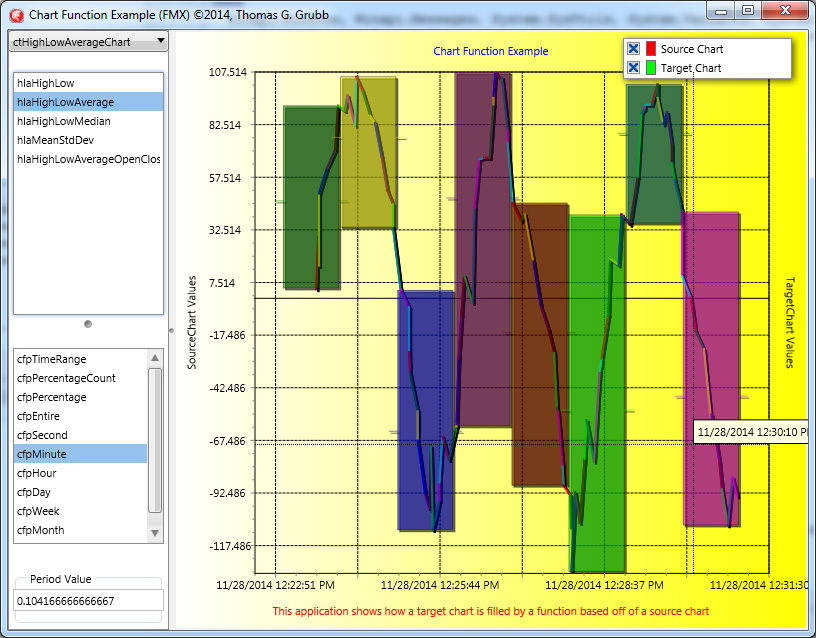
Implements a chart function class that applies a function to an input SourceChart and adds values to a RSBarCharts.TRSHighLowAverageChart or RSBarCharts.TRSCandleStickChart. The functions are able to modify multiple values of the Target chart at once (e.g., High, Low, and Average).
The TRSHighLowAverageChartFunction class provides specific functions applicable to high/low/average charts and candlestick charts. The function is applied over a Period of the SourceChart.
Chart Function Example showing automatic generation of hourly High/Low/Average data from a Source Line chart to a High/Low/Average Target Chart.
|
|
TRSHighLowAverageChartValue
|
Extends the RSBarCharts.TRSSparseBarChartValue class to provide the properties and methods needed to describe one bar of the RSBarCharts.TRSHighLowAverageChart component (i.e., bars do not extend up from the origin but rather have a high and low). The TRSHighLowAverageChartValue class uses the High and Low properties to specify the size of the bar. The Average property specifies a small average line in the bar.
|
|
TRSHighLowAverageChartValues
|
Defines the collection of all bars in a high/low/average bar chart (i.e., bars do not need to be right next to each other and they do not start at the origin). A high/low/average bar chart is made up of a collection of bars ( RSBarCharts.TRSHighLowAverageChartValue ), where each TRSHighLowAverageChartValue defines the information for one bar for the chart. The TRSHighLowAverageChartValue class defines the common properties to all bars, including X, Value, High, Low, Average, Caption, and Color. The TRSHighLowAverageChartValues collection defines the common properties to all bar values, such as DimensionCount, MaxValues, and MinValues.
Note that the TRSHighLowAverageChartValues collection provides built-in support for limiting the number of values in the collection (using the Limit property).
|
|
TRSHighLowAverageChartValuesEnumerator
|
Represents type TRSHighLowAverageChartValuesEnumerator.
|
|
TRSSparseBarChart
|
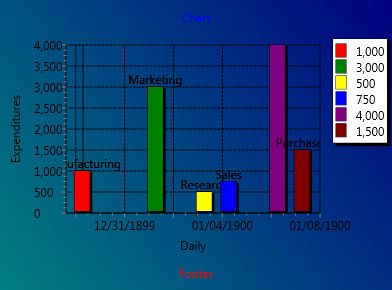
The TRSSparseBarChart component is a RSBarCharts.TRSCustomSparseBarChart descendant that represents a sparse bar chart, i.e., bars do not have to be besides each but spread through the horizontal axis . The Sparse Bar Chart displays each chart value ( RSBarCharts.TRSSparseBarChartValue ) by as a vertical or horizontal bar (depending on Orientation). Each value draws a separate bar and the order of the bars is based on the order of the TRSSparseBarChartValue in the collection.
The TRSSparseBarChartValue class uses the Value property to specify the height of each bar. The X property specifies where in the horizontal axis that bar is located.
Note
|
Charts are TGraphicControl descendants for VCL and TControl descendants for FMX. Display charts on a chart panel (with integrated axes, legend, header, footers, etc) or stand-alone (allowing use of FMX effects or embedding within other controls). Set the Panel property to the RSChartPanel.TRSChartPanel you want the chart displayed inside or nil for stand-alone use.
|
|
|
TRSSparseBarChartValue
|
Extends the RSBarCharts.TRSBarChartValue class to provide the properties and methods needed to describe one bar of the RSBarCharts.TRSSparseBarChart component (i.e., bars do not need to be right next to each other). The TRSSparseBarChartValue class uses the Value property to specify the height of the bar. The X property specifies where in the horizontal axis that bar is located.
|
|
TRSSparseBarChartValues
|
Defines the collection of all bars in a sparse bar chart (i.e., bars do not need to be right next to each other). A bar chart is made up of a collection of bars ( RSBarCharts.TRSSparseBarChartValue ), where each TRSSparseBarChartValue defines the information for one bar for the chart. The TRSSparseBarChartValue class defines the common properties to all bars, including X, Value, Caption, and Color. The TRSSparseBarChartValues collection defines the common properties to all bar values, such as DimensionCount, MaxValues, and MinValues.
Note that the TRSSparseBarChartValues collection provides built-in support for limiting the number of values in the collection (using the Limit property).
|
|
TRSSparseBarChartValuesEnumerator
|
Represents type TRSSparseBarChartValuesEnumerator.
|
