|
Name
|
Description
|

|
TRS2DChartValue
|
Extends the RSChartPanel.TRSChartValue class to provide the properties and methods needed to describe one 2D point. The TRS2DChartValue class is used by the RSCharts.TRSLineChart component among others. The TRS2DChartValue class adds the X and Y properties to define the location of the point.
|
|
TRS2DChartValues
|
Extends the RSChartPanel.TRSChartValues collection class to define a collection of 2D (X and Y) points in a chart, such as used in a line chart or point chart. The TRS2DChartValues collection manages a collection of RSCharts.TRS2DChartValue items, which define the X and Y coordinates of each point. The collection defines which dimensions of the Values property of a TRSChartValue contains the X dimension (XDim) and Y dimension (YDim).
Note that the TRS2DChartValues collection provides built-in support for limiting the number of values in the collection (using the Limit property).
|
|
TRS2DChartValuesEnumerator
|
Represents type TRS2DChartValuesEnumerator.
|
|
TRS2DImageChartValue
|
Extends the RSCharts.TRS2DChartValue class to provide the properties and methods needed to describe a 2D point that may have an image associated with it. The TRS2DImageChartValue class is used by the RSCharts.TRSPointChart component among others. The TRS2DImageChartValue class adds the ImageIndex property to specify the index of the image to use when drawing the point/image.
|
|
TRS2DImageChartValues
|
Extends the RSCharts.TRS2DChartValues class to provide the properties and methods needed to describe a 2D point that may have an image associated with it. The TRS2DImageChartValues class is used by the RSCharts.TRSPointChart component among others.
|
|
TRS2DImageChartValuesEnumerator
|
Represents type TRS2DImageChartValuesEnumerator.
|
|
TRS3DChartValue
|
Extends the RSCharts.TRS2DChartValue class to provide the properties and methods needed to describe 3D point. The X, Y, and Z properties specify the 3D coordinates of the point.
|
|
TRS3DChartValues
|
Extends the RSCharts.TRS2DChartValues collection class to define a collection of 3D (X, Y and Z) points in a chart. The TRS3DChartValues collection manages a collection of RSCharts.TRS3DChartValue items, which define the X, Y and Z coordinates of each point. The collection defines which dimensions of the Values property of a TRSChartValue contains the X dimension (XDim), Y dimension (YDim), and Z dimension (ZDim).
Note that the TRS3DChartValues collection provides built-in support for limiting the number of values in the collection (using the Limit property).
|
|
TRS3DChartValuesEnumerator
|
Represents type TRS3DChartValuesEnumerator.
|
|
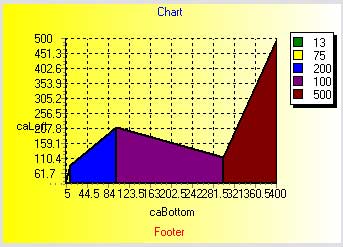
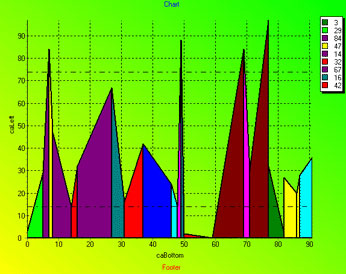
TRSAreaChart
|
The TRSAreaChart component represents a line chart ( RSCharts.TRSCustomLineChart ) where the area under the lines is also filled in. The Area Chart connects chart values ( RSCharts.TRS2DChartValue) by drawing a line between the points and filling in the area underneath the line to bottom axis of the chart panel.
 Note Note
|
Charts are TGraphicControl descendants for VCL and TControl descendants for FMX. Display charts on a chart panel (with integrated axes, legend, header, footers, etc) or stand-alone (allowing use of FMX effects or embedding within other controls). Set the Panel property to the RSChartPanel.TRSChartPanel you want the chart displayed inside or nil for stand-alone use.
|
|
|
TRSArrowChart
|
The TRSArrowChart component is a RSCharts.TRSChart descendant where each value in the chart represents one arrow. The Arrow Chart displays each chart value ( RSCharts.TRSArrowChartValue ) as an arrow connecting the end points defined for the value.
Note
|
Charts are TGraphicControl descendants for VCL and TControl descendants for FMX. Display charts on a chart panel (with integrated axes, legend, header, footers, etc) or stand-alone (allowing use of FMX effects or embedding within other controls). Set the Panel property to the RSChartPanel.TRSChartPanel you want the chart displayed inside or nil for stand-alone use.
|
|
|
TRSArrowChartValue
|
Extends the RSCharts.TRS2DChartValue class to describe one arrow in an arrow chart ( RSCharts.TRSArrowChart). The X and Y properties specify the start of the arrow and the EndX and EndY properties specify the end of the arrow.
|
|
TRSArrowChartValues
|
Extends the RSCharts.TRS2DChartValues class to define a collection of arrows in a chart, such as used in the RSCharts.TRSArrowChart . The TRSArrowChartValues collection manages a collection of RSCharts.TRSArrowChartValue items, which define the two points of an arrow (X, Y to EndX, EndY). The collection defines which dimensions of the Values property of a TRSArrowChartValue contains the starting point X, Y dimensions (XDim, YDim) and the ending point X, Y dimensions (EndXDim, EndYDim).
Note that the TRSArrowChartValues collection provides built-in support for limiting the number of arrows in the collection (using the Limit property).
|
|
TRSArrowChartValuesEnumerator
|
Represents type TRSArrowChartValuesEnumerator.
|
|
TRSChart
|
Extends the RSChartPanel.TRSCustomChart component to publish its properties. All of the chart types in the RCCS either directly or indirectly descend from this class. The TRSChart component provides the common properties and methods for a chart type, including the HorizontalAxis and VerticalAxis to use for the chart, Caption and Font , and most importantly, the Values property.
The Values property is the most important property of a chart type and allows you to define the chart values at design-time or run-time. It provides all the information about an individual chart point, not only position but also Caption, Visibility, and Selected. Each chart type uses the RSChartPanel.TRSChartValues class appropriate to their chart type, e.g., a bar chart has a 1D value type, line charts have 2D value types, and shape charts use 2D value types with shape/image information.
Note
|
Charts are TGraphicControl descendants for VCL and TControl descendants for FMX. Display charts on a chart panel (with integrated axes, legend, header, footers, etc) or stand-alone (allowing use of FMX effects or embedding within other controls). Set the Panel property to the RSChartPanel.TRSChartPanel you want the chart displayed inside or nil for stand-alone use.
|
|
|
TRSChartAxisCrack
|
Represents type TRSChartAxisCrack.
|
|
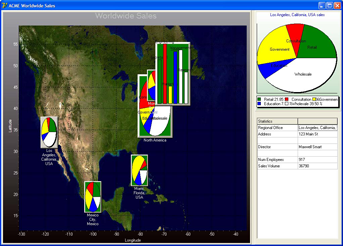
TRSChartInChart
|
The TRSChartInChart component is a RSCharts.TRSCustomShapeChart descendant where every value represents a chart inside a chart (similar to Picture-in-picture). The chart-in-chart displays chart values ( RSCharts.TRSChartInChartValue) as charts where each point can be its own chart (e.g., the point can be a pie chart, a bar chart, etc). Each point has its own shape and size as well as sub-chart. Only one-subchart per value is allowed, though multiple values are permitted.
 Important Note Important Note
|
The TRSChartInChart component will take care of freeing any sub-charts unless the subchart has an Owner.
|
Note
|
Charts are TGraphicControl descendants for VCL and TControl descendants for FMX. Display charts on a chart panel (with integrated axes, legend, header, footers, etc) or stand-alone (allowing use of FMX effects or embedding within other controls). Set the Panel property to the RSChartPanel.TRSChartPanel you want the chart displayed inside or nil for stand-alone use.
|
|
|
TRSChartInChartValue
|
Extends the RSCharts.TRSShapeChartValue class to provide the properties and methods needed to describe one sub-chart (e.g., a chart inside the chart, similar to Picture-in-picture). The TRSChartInChartValue class is used by the RSCharts.TRSChartInChart component. The SubChart property contains the embedded chart.
The TRSChartInChartValue class will ensure freeing the SubChart when being deleted (unless the SubChart's Owner is not nil).
|
|
TRSChartInChartValues
|
Extends the RSCharts.TRSShapeChartValues class to provide the properties and methods needed to describe one sub-chart (represented by the TRSChartInChartValue item). The TRSChartInChartValues class is used by the RSCharts.TRSChartInChart component
|
|
TRSChartInChartValuesEnumerator
|
Represents type TRSChartInChartValuesEnumerator.
|
|
TRSChartPointInfo
|
The TRSChartPointInfo class publishes the properties of the TRSCustomPointInfo class. It encapsulates the points metadata for a RSCharts.TRSPointChart (or RSCharts.TRSCustomPointChart) component. The TRSCustomPointChart component uses this class for its PointsInfo property, which specifies the appearance of all points in a point chart.
|
|
TRSCustomChartPointInfo
|
Encapsulates the points metadata for a RSCharts.TRSPointChart (or RSCharts.TRSCustomPointChart) component or encapsulates the default values for a RSCharts.TRSShapeChart component. The TRSCustomPointChart component uses this class for its PointsInfo property, which specifies the appearance of all points in a point chart. The RSCharts.TRSCustomDefaultShape class descends from this class to provide the default shape values (which can be overridden for each shape) in a shape chart
|
|
TRSCustomDefaultShape
|
Extends the RSCharts.TRSCustomChartPointInfo class to provide the default property values for shapes in a shape chart ( RSCharts.TRSCustomShapeChart or RSCharts.TRSShapeChart component). When you create a new shape in a shape chart, the new shape value ( RSCharts.TRSShapeChartValue ) is initialized to the DefaultShape of the shape chart.
Note
|
Unlike the TRSChartPointInfo class for the TRSCustomPointChart component, this class defines the default appearance of the shape. Each shape value can be modified after it is created.
|
|
|
TRSCustomLineChart
|
The TRSCustomLineChart component is a RSCharts.TRSChart descendant that represents a line and/or area chart. The custom line chart connects chart values ( RSCharts.TRS2DChartValue ) by drawing a line between the points. The TRSCustomLineChart component is a common base class for the line chart ( RSCharts.TRSLineChart ), area chart ( RSCharts.TRSAreaChart), and point and image chart ( RSCharts.TRSCustomPointChart) components.
Note
|
Charts are TGraphicControl descendants for VCL and TControl descendants for FMX. Display charts on a chart panel (with integrated axes, legend, header, footers, etc) or stand-alone (allowing use of FMX effects or embedding within other controls). Set the Panel property to the RSChartPanel.TRSChartPanel you want the chart displayed inside or nil for stand-alone use.
|
|
|
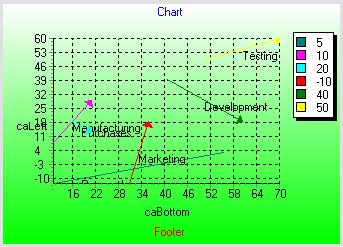
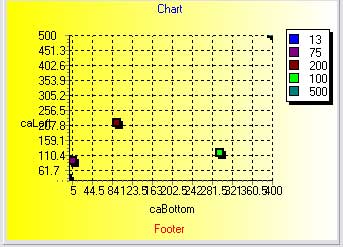
TRSCustomPointChart
|
The TRSCustomPointChart component is a RSChartPanel.TRSCustomChart descendant that represents a point/shape/image chart. It descends from RSCharts.TRSCustomLineChart to display chart values ( RSCharts.TRS2DImageChartValue) as points/images/shapes. The TRSCustomPointChart component is a common base class for the point chart ( RSCharts.TRSPointChart ) and shape chart ( RSCharts.TRSShapeChart). The TRSPointChart component displays all points as the same size and type of point (defined by the PointsInfo property). The TRSShapeChart component, on the other hand, allows each point to have individual shapes as well as size.
Note
|
Charts are TGraphicControl descendants for VCL and TControl descendants for FMX. Display charts on a chart panel (with integrated axes, legend, header, footers, etc) or stand-alone (allowing use of FMX effects or embedding within other controls). Set the Panel property to the RSChartPanel.TRSChartPanel you want the chart displayed inside or nil for stand-alone use.
|
|
|
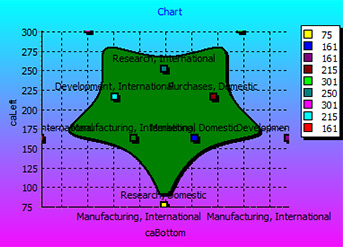
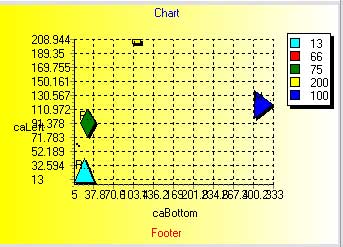
TRSCustomShapeChart
|
The TRSShapeChart component is a RSChartPanel.TRSCustomChart descendant that represents a shape chart. The shape chart displays chart values ( RSCharts.TRSShapeChartValue) as shapes where each point can have its own shape as well as size. If you want all points to be the same size and type of shape, use the RSCharts.TRSPointChart component. The TRSCustomShapeChart component is a common base class for the shape chart ( TRSShapeChart ) and the graph chart ( TRSGraphChart).
Note
|
Charts are TGraphicControl descendants for VCL and TControl descendants for FMX. Display charts on a chart panel (with integrated axes, legend, header, footers, etc) or stand-alone (allowing use of FMX effects or embedding within other controls). Set the Panel property to the RSChartPanel.TRSChartPanel you want the chart displayed inside or nil for stand-alone use.
|
|
|
TRSDefaultShape
|
The TRSDefaultShape class publishes the properties of the RSCharts.TRSCustomDefaultShape class. It extends the TRSCustomChartPointInfo class to provide the default property values for shapes in a shape chart ( RSCharts.TRSCustomShapeChart or RSCharts.TRSShapeChart component)
Note
|
Unlike the TRSChartPointInfo class for the TRSCustomPointChart component, this class defines the default appearance of the shape. Each shape value can be modified after it is created.
|
|
|
TRSGuideChart
|
The TRSGuideChart component is a RSChartPanel.TRSCustomChart descendant that represents guides. Guides are horizontal or vertical lines, similar to Photoshop guides, that help the user more quickly see other chart values. A guide chart is meant to be used with other chart types to help users interpret the values. For example, you could create a horizontal guide at Y=100, which would display a horizontal line across the chart panel at Y=100. The user can then use this guide to see at a glance which values from a line chart are above or below 100.
Note that all guides share the same pen and brush of the chart. If you wish to have guides with different looks, drop a new TRSGuideChart on your form.
Note
|
Charts are TGraphicControl descendants for VCL and TControl descendants for FMX. Display charts on a chart panel (with integrated axes, legend, header, footers, etc) or stand-alone (allowing use of FMX effects or embedding within other controls). Set the Panel property to the RSChartPanel.TRSChartPanel you want the chart displayed inside or nil for stand-alone use.
|
|
|
TRSGuideChartBrush
|
Changes the default published Kind and Style so they are not stream
|
|
TRSGuideChartPen
|
Changes the default published Style so that it is not streamed
|
|
TRSGuideChartValue
|
Extends the RSCharts.TRS2DChartValue class to provide the properties and methods needed to describe one guide. Guides are horizontal or vertical lines, similar to Photoshop guides, that help the user more quickly see other chart values. A guide chart is meant to be used with other chart types to help users interpret the values. For example, you could create a horizontal guide at Y=100, which would display a horizontal line across the chart panel at Y=100. The user can then use this guide to see at a glance which values from a line chart are above or below 100.
The TRSGuideChartValue class is used by the RSCharts.TRSGuideChart component. The TRSGuideChartValue class contains the X, Y and Orientation properties to define one guide.
|
|
TRSGuideChartValues
|
Extends the RSCharts.TRS2DChartValues collection class to define a collection of guides ( RSCharts.TRSGuideChartValue ). Guides are horizontal or vertical lines, similar to Photoshop guides, that help the user more quickly see other chart values. A guide chart is meant to be used with other chart types to help users interpret the values. For example, you could create a horizontal guide at Y=100, which would display a horizontal line across the chart panel at Y=100. The user can then use this guide to see at a glance which values from a line chart are above or below 100.
The TRSGuideChartValues class is used by the RSCharts.TRSGuideChart component.
|
|
TRSGuideChartValuesEnumerator
|
Represents type TRSGuideChartValuesEnumerator.
|
|
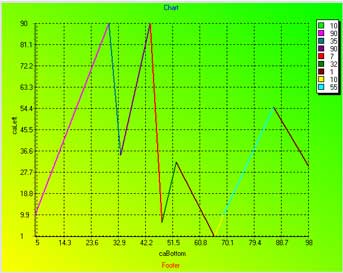
TRSLineChart
|
The TRSLineChart component is a RSChartPanel.TRSCustomChart descendant that represents a line chart (it descends from the RSCharts.TRSCustomLineChart component). The Line Chart connects chart values ( RSCharts.TRS2DChartValue ) by drawing a line between the points.
Note
|
Charts are TGraphicControl descendants for VCL and TControl descendants for FMX. Display charts on a chart panel (with integrated axes, legend, header, footers, etc) or stand-alone (allowing use of FMX effects or embedding within other controls). Set the Panel property to the RSChartPanel.TRSChartPanel you want the chart displayed inside or nil for stand-alone use.
|
|
|
TRSLineChartPen
|
Changes the default published width so that it is not streamed
|
|
TRSPathChart
|
The TRSPathChart component is a RSChartPanel.TRSCustomChart descendant that represents a path chart. The path chart displays chart values ( RSCharts.TRSPathChartValue) as irregular shapes defined by paths representing groups of connected curves and lines. Every value in the chart has its own path and maintains the coordinates of geometric shapes in world coordinate space in an array of path points. Each saved point has a specific type, to identify the primitive shape it is defining. Complex shapes of a TPathData are composed of a sequence of primitive shapes like lines and curves.
In addition to using code to define your path shape, each value has a Data property which accepts a string defining the shape. This string uses the same format as the TPath FMX component, which is also the same format as the paths defined in SVG files. To show SVG shapes, copy the paths to chart values.
Note: Most SVG shapes are defined assuming the 0, 0 point is in the top-left. You may need to invert the LeftAxis in order to see the path shape properly.
Note
|
Charts are TGraphicControl descendants for VCL and TControl descendants for FMX. Display charts on a chart panel (with integrated axes, legend, header, footers, etc) or stand-alone (allowing use of FMX effects or embedding within other controls). Set the Panel property to the RSChartPanel.TRSChartPanel you want the chart displayed inside or nil for stand-alone use.
|
|
|
TRSPathChartValue
|
Extends the RSCharts.TRS2DChartValue class to provide the properties and methods needed to describe one path shape. The TRSPathChartValue class is used by the RSCharts.TRSPathChart component.
|
|
TRSPathChartValues
|
Extends the RSCharts.TRS2DChartValues class to provide the properties and methods needed to describe one shape (rectangle, triangle, circle, etc, represented by the RSCharts.TRSShapeChartValue item). The TRSShapeChartValues class is used by the RSCharts.TRSPathChart component.
|
|
TRSPathChartValuesEnumerator
|
Represents type TRSPathChartValuesEnumerator.
|
|
TRSPieChart
|
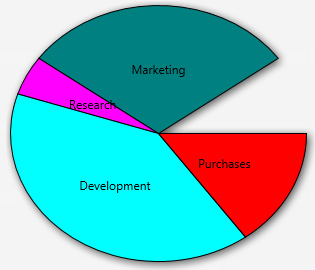
The TRSPieChart component is a RSChartPanel.TRSCustomChart descendant that represents a pie chart. The Pie Chart displays each chart value ( RSCharts.TRSPieChartValue) as a slice of the pie in the pie chart. The size of the slice is dependant on all the other slices in the pie chart, e.g., the size of a slice is proportional to the percentage that the pie slice's value is to the sum of all slices. The pie chart draws each slice starting from 3 o'clock position on a clock and goes counter-clockwise from there. Modify the Offset angle to change the starting angle.
Note that the pie chart always fills the rectangle between the axes on the chart panel, e.g., you cannot zoom in on a pie chart. You can, however, change the OuterRadius property to shrink the pie chart and the Origin property to move its center point.
|
|
|
|
|
|
|
|
|
|
|
|
|
|
|
|
|
|
|
|
|
|
|
|
|
|
|
|
|
|
|
|
|
|
|
|
|