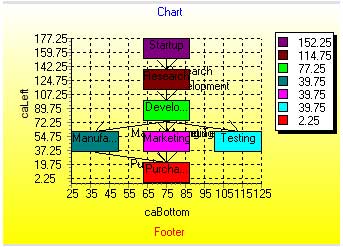
The TRSGraphChart component is a FMX.RS.Charts.TRSShapeChart descendant that provides a visual representation of a graph or network with nodes and links between them, similar to a flow chart or org chart. The Graph Chart connects chart values ( RSGraphCharts|TRSGraphChartValue ) by drawing an arrow representing the link ( RSGraphCharts|TRSGraphChartLink ) between the shapes.
A lot of graph charts, such as org charts and flow charts, are not just scattered about the chart surface. There is a definite organization, e.g., things flow from a top to a bottom (or a left to a right) and many nodes are considered equivalent so they are placed at the same level as other nodes. Each TRSGraphChartValue has a Level property, which is an integer property from 0 to whatever specifying the level of a node. This Level property is used by the Arrange method to divide the chart canvas into a big grid, where each cell in the grid can contain one chart value. One axis of this virtual grid will be the Levels in the chart. The other axis will be all the nodes/values at that level.
Namespace: FMX.RS.GraphCharts
TControl |
Delphi |
type |
|
|
The grid would look like this:
The Arrange method makes nodes of the same level the same size but different levels can have a different level size. |
||||||||||||||||||||||||||||||||||||||||||||||||||||||||||||||||||||||||||||||||||||||||||||||||||||||||||||||||||||||||||||||||||||||||||||||||||||||||||||||||||||||||||||||||||||||||||||||||||||||||||||||||||||||||||||||||||||||||||||||||||||||||||||||||||||
|
Represents method Assign(TPersistent). (Overrides FMX.RS.Charts.TRSCustomPointChart.Assign(TPersistent).) |
|||||||||||||||||||||||||||||||||||||||||||||||||||||||||||||||||||||||||||||||||||||||||||||||||||||||||||||||||||||||||||||||||||||||||||||||||||||||||||||||||||||||||||||||||||||||||||||||||||||||||||||||||||||||||||||||||||||||||||||||||||||||||||||||||||
|
Represents method AxisChanged(TRSChartAxis). (Inherited from FMX.RS.ChartPanel.TRSCustomChart.) |
|||||||||||||||||||||||||||||||||||||||||||||||||||||||||||||||||||||||||||||||||||||||||||||||||||||||||||||||||||||||||||||||||||||||||||||||||||||||||||||||||||||||||||||||||||||||||||||||||||||||||||||||||||||||||||||||||||||||||||||||||||||||||||||||||||
|
Creates an array of points for all the values in the chart and returns the FirstIndex in FI and LastIndex in LI. (Inherited from FMX.RS.Charts.TRSCustomLineChart.) |
|||||||||||||||||||||||||||||||||||||||||||||||||||||||||||||||||||||||||||||||||||||||||||||||||||||||||||||||||||||||||||||||||||||||||||||||||||||||||||||||||||||||||||||||||||||||||||||||||||||||||||||||||||||||||||||||||||||||||||||||||||||||||||||||||||
|
Overloaded. Represents method Changed. (Inherited from FMX.RS.ChartPanel.TRSCustomChart.) |
|||||||||||||||||||||||||||||||||||||||||||||||||||||||||||||||||||||||||||||||||||||||||||||||||||||||||||||||||||||||||||||||||||||||||||||||||||||||||||||||||||||||||||||||||||||||||||||||||||||||||||||||||||||||||||||||||||||||||||||||||||||||||||||||||||
|
Overloaded. Represents method Changed(TRSChartValue). (Inherited from FMX.RS.ChartPanel.TRSCustomChart.) |
|||||||||||||||||||||||||||||||||||||||||||||||||||||||||||||||||||||||||||||||||||||||||||||||||||||||||||||||||||||||||||||||||||||||||||||||||||||||||||||||||||||||||||||||||||||||||||||||||||||||||||||||||||||||||||||||||||||||||||||||||||||||||||||||||||
|
Creates a "deep" copy of the chart. It constructs a new chart of the correct type and then calls the Assign method to copy its properties to the new copy.
|
|||||||||||||||||||||||||||||||||||||||||||||||||||||||||||||||||||||||||||||||||||||||||||||||||||||||||||||||||||||||||||||||||||||||||||||||||||||||||||||||||||||||||||||||||||||||||||||||||||||||||||||||||||||||||||||||||||||||||||||||||||||||||||||||||||
|
Represents method CreateBrush. (Inherited from FMX.RS.ChartPanel.TRSCustomChart.) |
|||||||||||||||||||||||||||||||||||||||||||||||||||||||||||||||||||||||||||||||||||||||||||||||||||||||||||||||||||||||||||||||||||||||||||||||||||||||||||||||||||||||||||||||||||||||||||||||||||||||||||||||||||||||||||||||||||||||||||||||||||||||||||||||||||
|
Creates the FMX.RS.ChartPanel.TRSChartValues class for the Values property
|
|||||||||||||||||||||||||||||||||||||||||||||||||||||||||||||||||||||||||||||||||||||||||||||||||||||||||||||||||||||||||||||||||||||||||||||||||||||||||||||||||||||||||||||||||||||||||||||||||||||||||||||||||||||||||||||||||||||||||||||||||||||||||||||||||||
|
Represents method CreateFont. (Inherited from FMX.RS.ChartPanel.TRSCustomChart.) |
|||||||||||||||||||||||||||||||||||||||||||||||||||||||||||||||||||||||||||||||||||||||||||||||||||||||||||||||||||||||||||||||||||||||||||||||||||||||||||||||||||||||||||||||||||||||||||||||||||||||||||||||||||||||||||||||||||||||||||||||||||||||||||||||||||
|
Represents method CreatePen. (Overrides FMX.RS.ChartPanel.TRSCustomChart.CreatePen.) |
|||||||||||||||||||||||||||||||||||||||||||||||||||||||||||||||||||||||||||||||||||||||||||||||||||||||||||||||||||||||||||||||||||||||||||||||||||||||||||||||||||||||||||||||||||||||||||||||||||||||||||||||||||||||||||||||||||||||||||||||||||||||||||||||||||
|
Creates the default PointsInfo object (Overrides FMX.RS.Charts.TRSCustomPointChart.CreatePointsInfo.) |
|||||||||||||||||||||||||||||||||||||||||||||||||||||||||||||||||||||||||||||||||||||||||||||||||||||||||||||||||||||||||||||||||||||||||||||||||||||||||||||||||||||||||||||||||||||||||||||||||||||||||||||||||||||||||||||||||||||||||||||||||||||||||||||||||||
|
Creates sample values for illustrating how the chart will look. This function is automatically called at design-time to fill the chart with sample values. It can also be called at run-time to add more values to the chart (i.e., the chart is not cleared first)
|
|||||||||||||||||||||||||||||||||||||||||||||||||||||||||||||||||||||||||||||||||||||||||||||||||||||||||||||||||||||||||||||||||||||||||||||||||||||||||||||||||||||||||||||||||||||||||||||||||||||||||||||||||||||||||||||||||||||||||||||||||||||||||||||||||||
|
Represents method DoUpdateAxisInfo(TRSChartAxis). (Inherited from FMX.RS.ChartPanel.TRSCustomChart.) |
|||||||||||||||||||||||||||||||||||||||||||||||||||||||||||||||||||||||||||||||||||||||||||||||||||||||||||||||||||||||||||||||||||||||||||||||||||||||||||||||||||||||||||||||||||||||||||||||||||||||||||||||||||||||||||||||||||||||||||||||||||||||||||||||||||
|
Overloaded. Paints the chart to the specified Canvas in the specified location. The Draw method first calls the OnDrawing event, which signals that it is about to draw and allows users to stop the drawing before it occurs. Then, it calls the protected InternalDraw method to actually do the drawing. Finally, it calls the OnDraw event to signal the end of drawing of the chart. Use the Draw method to paint the chart to any canvas and anywhere and with any size on the canvas.
|
(Inherited from FMX.RS.ChartPanel.TRSCustomChart.)
![]()
Draw(TCanvas,TCanvasRect,TRSChartAxis,TRSChartAxis,Boolean,Boolean)
Overloaded. Paints the chart to the specified Canvas in the specified location. The Draw Method uses the supplied TRSChartAxis (instead of the HorizontalAxis and VerticalAxis properties) to convert the chart values into pixel coordinates.
Unlike the regular Draw method, this method draws the axes as well (useful for when the chart is not connected to a panel).
Use the Draw method to paint the chart to any canvas and anywhere and with any size on the canvas.
![]()
DrawArea(TCanvas,TRS2DChartValue,TCanvasRect,TCanvasPixel,TCanvasPixel,Boolean)
Draws the area under the line for that line segment (Inherited from FMX.RS.Charts.TRSCustomLineChart.)
![]()
DrawAxes(TCanvas,TCanvasRect,TRSChartAxis,TRSChartAxis)
Draws the specified axes to the Canvas (Inherited from FMX.RS.ChartPanel.TRSCustomChart.)
![]()
DrawGlyph(TCanvas,TCanvasRect)
Overloaded. Represents method DrawGlyph(TCanvas,TCanvasRect). (Inherited from FMX.RS.ChartPanel.TRSCustomChart.)
![]()
DrawGlyph(TCanvas,TRSChartValue,TCanvasRect)
Represents method DrawGlyph(TCanvas,TRSChartValue,TCanvasRect). (Overrides FMX.RS.Charts.TRSCustomPointChart.DrawGlyph(TCanvas,TRSChartValue,TCanvasRect).)
![]()
Calls the OnDrawing event and returns True if the draw process should continue.
This method is called before the InternalDraw method.
![]()
DrawLabel(TCanvas,String,TCanvasPixel,TCanvasPixel,Single)
Overloaded. Draws the text caption centered above the X, Y point without clipping.
|
|---|
The Opacity is ignored in VCL |
![]()
DrawLabel(TCanvas,String,TCanvasRect,Single)
Overloaded. Draws the text caption centered within the rectangle. The text is clipped
|
|---|
The Opacity is ignored in VCL |
![]()
DrawLabel(TCanvas,TRSChartValue,TCanvasPixel,TCanvasPixel)
Overloaded. Draws the text caption centered above the X, Y point without clipping.
|
|---|
The Opacity is specified by the FMX.RS.ChartPanel.TRSChartValue.Opacity property |
![]()
DrawLabel(TCanvas,TRSChartValue,TCanvasRect)
Draws a label for the TRSChartValue on the canvas. The text of the label is controlled by the ValueLabelStyle property.
The label is drawn within the specified rectangle.
|
|---|
The Opacity is specified by the FMX.RS.ChartPanel.TRSChartValue.Opacity property |
![]()
DrawLine(TCanvas,TCanvasRect,Boolean)
Overloaded. Draws the entire line for the chart. The method calls other methods depending on the LineStyle. (Inherited from FMX.RS.Charts.TRSCustomLineChart.)
![]()
DrawLine(TCanvas,TRS2DChartValue,TCanvasRect,TCanvasPixel,TCanvasPixel,Boolean)
Overloaded. Draws the line for the line segment (from last point value to this point value) (Inherited from FMX.RS.Charts.TRSCustomLineChart.)
![]()
DrawLink(TCanvas,TCanvasRect,TRSGraphChartValue,TRSGraphChartLink)
Draw one link
![]()
DrawLinks(TCanvas,TCanvasRect,TRSGraphChartValue)
Draw all the links from the input TRSGraphChartValue to other nodes
![]()
Calls the OnDraw event.
This method is called after the InternalDraw method.
![]()
DrawPoint(TCanvas,TCanvasRect,TRSPointChartValue)
Draws one point at the specified rectangle (Inherited from FMX.RS.Charts.TRSCustomPointChart.)
![]()
DrawShape(TCanvas,TCanvasRect,TRSShapeChartValue)
Draws one shape at the specified rectangle (Overrides FMX.RS.Charts.TRSCustomShapeChart.DrawShape(TCanvas,TCanvasRect,TRSShapeChartValue).)
![]()
DrawSmoothline(TCanvas,TCanvasRect,Boolean)
Draws the smooth line for the entire values collection (i.e., the LineStyle is lsCurveInterpolation or lsCurveApproximation). If the LineStyle is lsCurveInterpolation, it uses the DrawSmoothSegment method for each segment of the line. (Inherited from FMX.RS.Charts.TRSCustomLineChart.)
![]()
DrawSmoothSegment(TCanvas,TRS2DChartValue,TCanvasPoint,TCanvasPoints,Boolean)
Draws a smooth line segment using the SegmentPoints. The Line is assumed to touch all the segment points (i.e., the LineStyle is lsCurveInterpolation) (Inherited from FMX.RS.Charts.TRSCustomLineChart.)
![]()
Re-enables screen repainting and change events. Use EndUpdate to re-enable screen repainting and change events that were turned off with the BeginUpdate method. (Inherited from FMX.RS.ChartPanel.TRSCustomChart.)
![]()
FormatValue(TRSChartValue,TRSLabelTextStyle)
Generates a label for the Value based on the TextStyle (Inherited from FMX.RS.ChartPanel.TRSCustomChart.)
![]()
Returns the vertical offset ( OffsetVertical).
If coUseVerticalOffset is not in Options, this method always returns 0. If coUseVerticalOffset is in Options, the function returns the OffsetVertical value.
![]()
GetAxisCaption(TRSChartAxis,Integer,TRSChartValueType)
Returns a label for an axis ( FMX.RS.ChartPanel.TRSChartAxis ) based on the input Value. The Index specifies where to start looking in the chart Values (for optimization purposes) and decrements from there until the closest chart value is found. (Inherited from FMX.RS.ChartPanel.TRSCustomChart.)
![]()
![]()
Returns the chart type enumerated value for this class. Each chart class overrides this class function to return the RSChartConsts|TRSChartType enumerated value (Overrides FMX.RS.Charts.TRSCustomShapeChart.GetChartType.)
![]()
Represents method GetColor. (Overrides FMX.RS.ChartPanel.TRSCustomChart.GetColor.)
![]()
Overloaded. Returns the color of the chart value. The color of the TRSChartValue can change depending on the Options property as well as any other chart states (e.g., the TRSCandleStickChart class overrides this method to turn the color red or green depending on if the Open value is greater than the Closing Value) (Inherited from FMX.RS.ChartPanel.TRSCustomChart.)
![]()
GetCumulativeTotal(Integer,Integer,TRSCustomChartClass)
Determine the cumulative value at this index for all charts in the Group. The ValIndex specifies the TRSChartValue.Values dimension to compare.
Used for stacking charts.
![]()
GetCumulativeValue(Integer,Integer,TRSCustomChartClass)
Determine the cumulative value at this index for all charts below (spatially) this chart in the same Group. The ValIndex specifies the TRSChartValue.Values dimension to compare.
Used for stacking charts.
![]()
Represents method GetGroupDimension. (Inherited from FMX.RS.ChartPanel.TRSCustomChart.)
![]()
GetPoints(TCanvasPoint,TCanvasPoint,TCanvasRect)
Returns an array of points from StartPoint to EndPoint based on the LineStyle and LineChartElements (Inherited from FMX.RS.Charts.TRSCustomLineChart.)
![]()
GetShapeRect(TCanvasRect,TRSShapeChartValue)
Represents method GetShapeRect(TCanvasRect,TRSShapeChartValue). (Inherited from FMX.RS.Charts.TRSCustomShapeChart.)
![]()
Returns a new chart color based on the ChartColorScheme and ChartColorList. Every time a chart is created, it is assigned a new color from the current ChartColorList. (Inherited from FMX.RS.ChartPanel.TRSCustomChart.)
![]()
Initialize the OnChange events of structures. Use this method to assign event handlers for structures (e.g., Pen.OnChange := MyChangeMethod).
|
|---|
The constructor calls this method after it calls the InitializeChart method, which is where the structures should be actually created and initialized. |
![]()
Creates and initialize structures and values of chart. This method is the safe place to initialize chart values without change events occurring.
|
|---|
The constructor calls this method. Use this method to actually create and initialize properties. Do not assign event properties in this method (use the InitializeChangeEvents method instead) |
![]()
InternalDraw(TCanvas,TCanvasRect)
Overloaded. Paints the chart graphic to the specified canvas at the specified rectangle. The InternalDraw method is called by the Draw method.
Descendant classes of TRSCustomChart override the InternalDraw method to actually paint themselves.
|
|---|
The default InternalDraw method implementation assigns the Brush, Pen , and Font to the Canvas. |
![]()
InternalSelect(TCanvasRect,TRSChartSelectionAction)
Selects or deselects chart Values ( FMX.RS.ChartPanel.TRSChartValue ) based on whether they intersect with the selection rectangle (which is in pixel coordinates).
The base method converts the SelectionRect to chart coordinates (based on HorizontalAxis and VerticalAxis) and then selects values based on the TRSChartValue.Selectable method
![]()
Represents method Invalidate. (Inherited from FMX.RS.ChartPanel.TRSCustomChart.)
![]()
Returns True if any value in the chart intersects with the SelectionRect (Inherited from FMX.RS.ChartPanel.TRSCustomChart.)
![]()
Represents method IsValuesStored. (Inherited from FMX.RS.ChartPanel.TRSCustomChart.)
![]()
Indicates whether the chart is visible. A chart is visible if its Visible property is True and both axes have been assigned. (Inherited from FMX.RS.ChartPanel.TRSCustomChart.)
![]()
LevelChanged(TRSGraphChartValue)
Represents method LevelChanged(TRSGraphChartValue).
![]()
LinksNotify(TRSGraphChartLink,TCollectionNotification)
Represents method LinksNotify(TRSGraphChartLink,TCollectionNotification).
![]()
LinksUpdate(TRSGraphChartLink)
Represents method LinksUpdate(TRSGraphChartLink).
![]()
Represents method Loaded. (Inherited from FMX.RS.ChartPanel.TRSCustomChart.)
![]()
Represents method MouseHover(TCanvasRect). (Inherited from FMX.RS.ChartPanel.TRSCustomChart.)
![]()
Notification(TComponent,TOperation)
Represents method Notification(TComponent,TOperation). (Overrides FMX.RS.ChartPanel.TRSCustomChart.Notification(TComponent,TOperation).)
![]()
Represents method OrientationChanged.
![]()
Represents method Paint. (Inherited from FMX.RS.ChartPanel.TRSCustomChart.)
![]()
Represents method PanelChanged. (Inherited from FMX.RS.ChartPanel.TRSCustomChart.)
![]()
SaveCanvasResources(TCanvas,TBrush,TRSPen,TFont)
Represents method SaveCanvasResources(TCanvas,TBrush,TRSPen,TFont). (Inherited from FMX.RS.ChartPanel.TRSCustomChart.)
![]()
Select(TCanvasRect,TRSChartSelectionAction)
Selects or deselects chart Values ( FMX.RS.ChartPanel.TRSChartValue ) based on whether they intersect with the selection rectangle (which is in pixel coordinates).
The base method converts the SelectionRect to chart coordinates (based on HorizontalAxis and VerticalAxis) and then selects values based on the TRSChartValue.Selectable method
|
|---|
Descendant classes override the InternalSelect method |
![]()
Represents method SelectionColorChanged. (Inherited from FMX.RS.ChartPanel.TRSCustomChart.)
![]()
Overloaded. Represents method SenderChanged(TObject). (Inherited from FMX.RS.ChartPanel.TRSCustomChart.)
![]()
SetCanvasResources(TCanvas,TBrush,TRSPen,TFont,Boolean,Boolean)
Overloaded. Represents method SetCanvasResources(TCanvas,TBrush,TRSPen,TFont,Boolean,Boolean). (Inherited from FMX.RS.ChartPanel.TRSCustomChart.)
![]()
SetCanvasResources(TCanvas,TRSChartValue,Boolean,Boolean)
Represents method SetCanvasResources(TCanvas,TRSChartValue,Boolean,Boolean). (Overrides FMX.RS.Charts.TRSCustomPointChart.SetCanvasResources(TCanvas,TRSChartValue,Boolean,Boolean).)
![]()
Represents method SetColor(TCanvasColor). (Overrides FMX.RS.ChartPanel.TRSCustomChart.SetColor(TCanvasColor).)
![]()
Represents method SetOptions(TChartOptions). (Overrides FMX.RS.ChartPanel.TRSCustomChart.SetOptions(TChartOptions).)
![]()
Represents method SetVisible(Boolean). (Inherited from FMX.RS.ChartPanel.TRSCustomChart.)
![]()
Represents method UpdateAxisInfo(TRSChartAxis). (Overrides FMX.RS.ChartPanel.TRSCustomChart.UpdateAxisInfo(TRSChartAxis).)
![]()
Updates the values to the current color scheme. If PanelColorScheme is True then uses the Panel's color scheme (Inherited from FMX.RS.ChartPanel.TRSCustomChart.)
![]()
ValueNotify(TRSChartValue,TCollectionNotification)
Represents method ValueNotify(TRSChartValue,TCollectionNotification). (Inherited from FMX.RS.Charts.TRSCustomShapeChart.)
![]()
ValueSelectionChanged(TRSChartValue)
Represents method ValueSelectionChanged(TRSChartValue). (Inherited from FMX.RS.ChartPanel.TRSCustomChart.)
![]()
ValueVisibleChanged(TRSChartValue)
Represents method ValueVisibleChanged(TRSChartValue). (Inherited from FMX.RS.ChartPanel.TRSCustomChart.)
![]()
Represents method VisibleChanged. (Inherited from FMX.RS.ChartPanel.TRSCustomChart.)
![]()
Returns true if the chart prefers Captions over Values for its labels on the input Axis. This method provides a hint to the TRSChartAxis when LabelStyle is alsAutomatic. (Inherited from FMX.RS.ChartPanel.TRSCustomChart.)
|
In the Create New Chart Types Tutorial, we discuss how we created the graph chart. You should check it out for tips on building charts in general and the graph chart in particular. |
To display a chart, you drop the component on a form and optionally connect its Panel property to the FMX.RS.ChartPanel.TRSChartPanel component where you want it to be displayed. The Values property is the most important property of the chart type and allows you to define the chart values at design-time or run-time. For the Graph Chart, the Values property contains TRSGraphChartValue collection items which define the node of a graph and contains the links (TRSGraphChartLink) from that node to other nodes. To display a graph chart inside a chart panel:
|
To add a node to the chart (at Design-Time):
|
To add a node to the chart (at Run-Time):
Delphi |
|---|
var |
Reference
|
