Hide Comments
Hide Comments

TRSEQChart Class

Comments (0)

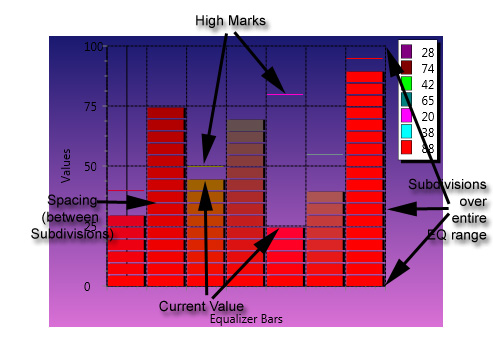
The TRSEQChart component is a RSCharts.TRSChart descendant that provides an "equalizer" visualization. The TRSEQChart is similar to a bar chart ( RSBarCharts|TRSBarChart ) where every bar is made up of blocks and there are high water marks for each bar (think of a music equalizer). The EQ Chart displays each chart value ( RSCharts.TRSEQChartValue ) by as a vertical or horizontal bar (depending on    Orientation), broken up into equal size blocks (except possibly the last block). Each value draws a separate bar and the order of the bars is based on the order of the TRSEQChartValue in the collection
 

EQChartExample2

Namespace: RSCharts

expandingInheritance Hierarchy

TGraphicControl
  RSChartPanel.TRSCustomChart
    RSCharts.TRSChart
      RSCharts.TRSEQChart
 

expandingSyntax

Delphi

type
  TRSEQChart = class(TRSChart)
  end; 
 

expandingConstructors


Name

Description

public constructor

Create(TComponent)

Initializes a new instance of the TRSCustomChart class. (Inherited from RSChartPanel.TRSCustomChart.)

Top

expandingProperties


Name

Description

published property

Align

Represents property Align. (Inherited from RSCharts.TRSChart.)

published property

Anchors

Represents property Anchors. (Inherited from RSCharts.TRSChart.)

protected property

AxesHints

 (Inherited from RSChartPanel.TRSCustomChart.)

public property

BarSize

Returns the actual size of the each bar in pixels. The BarSize is calculated by taking the size of the ChartRect of the TRSCustomChartPanel, dividing it by the number of bars, and then using the EQSizePct of the remainder.
 

published property

Brush

Represents property Brush. (Inherited from RSCharts.TRSChart.)

published property

Caption

Represents property Caption. (Inherited from RSCharts.TRSChart.)

published property

Color

Represents property Color. (Inherited from RSCharts.TRSChart.)

published property

Constraints

Represents property Constraints. (Inherited from RSCharts.TRSChart.)

public property

Cursor

Specifies the Cursor to display when the mouse is over the chart (Inherited from RSChartPanel.TRSCustomChart.)

published property

Enabled

Represents property Enabled. (Inherited from RSCharts.TRSChart.)

published property

EQOptions

Defines the set of options to apply for the equalizer chart

published property

EQSizePct

Specifies the size of the EQ bar as a percentage between 1 and 100. The available canvas is divided by the number of bars in the EQ chart to obtain the maximum size of each individual EQ bar. Then, the EQSizePct specifies the size of the bar as a percentage of this maximum size.

public property

FirstIndex

The FirstIndex and the     LastIndex properties define the indices of the Values that are currently being drawn in the chart.

Usually, these properties are equivalent to 0 for the FirstIndex and Values.Count-1 for the LastIndex. However, when the TRSChartPanel component has been zoomed, these properties reflect the point just before the first point in the zoomed area and the point just after the last point in the zoomed area (this ensures the visual aspect of the chart by allowing, for example, lines to be drawn into and out of the zoomed area. The FirstIndex and LastIndex properties provide more efficient access to only the values that are currently being drawn.

noteNote

For charts that don't have an easy visual ordering (such as a shape chart where depending on sizes things can overlap), the FirstIndex and LastIndex will be the entire Values collection.

published property

Font

Represents property Font. (Inherited from RSCharts.TRSChart.)

published property

Group

Represents property Group. (Inherited from RSCharts.TRSChart.)

public property

GroupIndex

Use the GroupIndex property to specify the ordering of the charts in a group at design time (Inherited from RSChartPanel.TRSCustomChart.)

published property

GroupStyle

Represents property GroupStyle. (Inherited from RSCharts.TRSChart.)

published property

HorizAxis

Represents property HorizAxis. (Inherited from RSCharts.TRSChart.)

published property

HorizontalAxis

Represents property HorizontalAxis. (Inherited from RSCharts.TRSChart.)

public property

LastIndex

The FirstIndex and the     LastIndex properties define the indices of the Values that are currently being drawn in the chart.

Usually, these properties are equivalent to 0 for the FirstIndex and Values.Count-1 for the LastIndex. However, when the TRSChartPanel component has been zoomed, these properties reflect the point just before the first point in the zoomed area and the point just after the last point in the zoomed area (this ensures the visual aspect of the chart by allowing, for example, lines to be drawn into and out of the zoomed area. The FirstIndex and LastIndex properties provide more efficient access to only the values that are currently being drawn.

noteNote

For charts that don't have an easy visual ordering (such as a shape chart where depending on sizes things can overlap), the FirstIndex and LastIndex will be the entire Values collection.

public property

Listeners

Tracks the RSChartPanel.IChartPanelListeners which are listening for changes to this chart. The TRSCustomChart class uses this list to automatically notify listeners when the chart or its values change.

Add a class to this list in order for it to receive change events from the chart.

protected property

LocalHorizontalAxis

Represents property LocalHorizontalAxis. (Inherited from RSChartPanel.TRSCustomChart.)

protected property

LocalVerticalAxis

Represents property LocalVerticalAxis. (Inherited from RSChartPanel.TRSCustomChart.)

published property

Max

Specifies the maximum height/value for all the equalizer bars in the EQ Chart. Use the Max and   Min properties to specify the value range for the equalizer bars.

published property

MaxColor

Specifies the color that the gradient should be at the end, or top, of the equalizer bar (over the full range specified by   Max and Min).

published property

Min

Specifies the minimum height/value for all the equalizer bars in the EQ Chart. Use the Max and   Min properties to specify the value range for the equalizer bars.

published property

MinColor

Specifies the color that the gradient should be at the start, or bottom, of the equalizer bar (over the full range specified by   Max and Min).

published property

OffsetVertical

Represents property OffsetVertical. (Inherited from RSCharts.TRSChart.)

published property

OnChange

Represents property OnChange. (Inherited from RSCharts.TRSChart.)

published property

OnDraw

Represents property OnDraw. (Inherited from RSCharts.TRSChart.)

published property

OnDrawing

Represents property OnDrawing. (Inherited from RSCharts.TRSChart.)

published property

OnValueChange

Represents property OnValueChange. (Inherited from RSCharts.TRSChart.)

published property

OnValueSelectionChange

Represents property OnValueSelectionChange. (Inherited from RSCharts.TRSChart.)

published property

OnValueVisibleChange

Represents property OnValueVisibleChange. (Inherited from RSCharts.TRSChart.)

published property

OnVisibleChange

Represents property OnVisibleChange. (Inherited from RSCharts.TRSChart.)

published property

Opacity

Represents property Opacity. (Inherited from RSCharts.TRSChart.)

published property

Options

Represents property Options. (Inherited from RSCharts.TRSChart.)

published property

Orientation

Specifies the direction the EQ bars are displayed in the EQ chart. The default orientation is boVertical

published property

Panel

Represents property Panel. (Inherited from RSCharts.TRSChart.)

published property

ParentFont

Represents property ParentFont. (Inherited from RSCharts.TRSChart.)

published property

ParentSelectionColor

Represents property ParentSelectionColor. (Inherited from RSCharts.TRSChart.)

published property

Pen

Represents property Pen. (Inherited from RSCharts.TRSChart.)

published property

PopupMenu

Represents property PopupMenu. (Inherited from RSCharts.TRSChart.)

published property

Preview

Represents property Preview. (Inherited from RSCharts.TRSChart.)

published property

SelectionColor

Represents property SelectionColor. (Inherited from RSCharts.TRSChart.)

published property

ShowHint

Represents property ShowHint. (Inherited from RSCharts.TRSChart.)

published property

Spacing

Specifies the spacing between equalizer bars as a percentage (0-100) of the size of each equalizer bar. The default is 10 which means 10% of the small EQ bars are empty.

EQChartDescription

protected property

State

Represents property State. (Inherited from RSChartPanel.TRSCustomChart.)

published property

Style

Defines how the equalizer bars are drawn

EQChartDescription

published property

Subdivisions

Specifies how many smaller equalizer bars should make up the full range of the equalizer bar.

EQChartDescription

published property

ValueLabelFormat

Represents property ValueLabelFormat. (Inherited from RSCharts.TRSChart.)

published property

ValueLabelStyle

Represents property ValueLabelStyle. (Inherited from RSCharts.TRSChart.)

published property

Values

Contains all the EQ bars in the equalizer chart. Each item ( RSCharts.TRSEQChartValue ) specifies one bar and its properties, including Value and Caption. Use the Values collection to add, delete, and modify EQ bars in the chart.
 

published property

VertAxis

Represents property VertAxis. (Inherited from RSCharts.TRSChart.)

published property

VerticalAxis

Represents property VerticalAxis. (Inherited from RSCharts.TRSChart.)

published property

Visible

Represents property Visible. (Inherited from RSCharts.TRSChart.)

public property

VisibleCount

Returns the number of TRSChartValue that are visible for the chart (Inherited from RSChartPanel.TRSCustomChart.)

Top

expandingMethods


Name

Description

public method

Assign(TPersistent)

Represents method Assign(TPersistent). (Overrides RSChartPanel.TRSCustomChart.Assign(TPersistent).)

protected method

AxisChanged(TRSChartAxis)

Represents method AxisChanged(TRSChartAxis). (Inherited from RSChartPanel.TRSCustomChart.)

public method

BeginUpdate

Suspends screen repainting of the chart. The BeginUpdate method suspends screen repainting and change events until the EndUpdate method is called. Use BeginUpdate to speed processing and avoid flicker while items are added to or deleted from a collection. (Inherited from RSChartPanel.TRSCustomChart.)

protected method

Changed

Overloaded. Represents method Changed. (Inherited from RSChartPanel.TRSCustomChart.)

protected method

Changed(TRSChartValue)

Overloaded. Represents method Changed(TRSChartValue). (Inherited from RSChartPanel.TRSCustomChart.)

public method

Clone

Creates a "deep" copy of the chart. It constructs a new chart of the correct type and then calls the Assign method to copy its properties to the new copy.

alert_cautionCaution

Note that the new TRSCustomChart has the same owner as the current chart. If there is no owner, you are responsible for freeing the new clone.

protected method

CMHitTest(TCMHitTest)

Represents method CMHitTest(TCMHitTest). (Inherited from RSChartPanel.TRSCustomChart.)

protected method

CMVisibleChanged(TMessage)

Represents method CMVisibleChanged(TMessage). (Inherited from RSChartPanel.TRSCustomChart.)

protected method

CreateBrush

Represents method CreateBrush. (Inherited from RSChartPanel.TRSCustomChart.)

protected method

CreateChartValues

Creates the RSChartPanel.TRSChartValues class for the   Values property

alert_noteNotes to Inheritors

Override this method to create your TRSChartValues descendant

protected method

CreateFont

Represents method CreateFont. (Inherited from RSChartPanel.TRSCustomChart.)

protected method

CreatePen

Represents method CreatePen. (Inherited from RSChartPanel.TRSCustomChart.)

public method

CreatePreviewValues

Creates sample values for illustrating how the chart will look. This function is automatically called at design-time to fill the chart with sample values. It can also be called at run-time to add more values to the chart (i.e., the chart is not cleared first)

noteNote

Set the Preview property to false to have the design-time sample values show up at run-time

protected method

DoUpdateAxisInfo(TRSChartAxis)

Represents method DoUpdateAxisInfo(TRSChartAxis). (Overrides RSChartPanel.TRSCustomChart.DoUpdateAxisInfo(TRSChartAxis).)

public method

Draw(TCanvas,TCanvasRect)

Overloaded.  Paints the chart to the specified Canvas in the specified location. The Draw method first calls the     OnDrawing event, which signals that it is about to draw and allows users to stop the drawing before it occurs. Then, it calls the protected     InternalDraw method to actually do the drawing. Finally, it calls the OnDraw event to signal the end of drawing of the chart.

Use the Draw method to paint the chart to any canvas and anywhere and with any size on the canvas.

alert_noteNotes to Callers

The Draw Method uses the     HorizontalAxis and     VerticalAxis properties to convert the chart values into pixel coordinates. If you want to use a different axis (but not change the above properties), call the overloaded Draw method.


 (Inherited from RSChartPanel.TRSCustomChart.)


public method

Draw(TCanvas,TCanvasRect,TRSChartAxis,TRSChartAxis,Boolean,Boolean)

Overloaded.  Paints the chart to the specified Canvas in the specified location. The Draw Method uses the supplied TRSChartAxis (instead of the     HorizontalAxis and     VerticalAxis properties) to convert the chart values into pixel coordinates.

Unlike the regular Draw method, this method draws the axes as well (useful for when the chart is not connected to a panel).

Use the Draw method to paint the chart to any canvas and anywhere and with any size on the canvas.

 (Inherited from RSChartPanel.TRSCustomChart.)

public method

DrawAxes(TCanvas,TCanvasRect,TRSChartAxis,TRSChartAxis)

Draws the specified axes to the Canvas (Inherited from RSChartPanel.TRSCustomChart.)

protected method

DrawBar(TCanvas,TCanvasRect,TCanvasRect,TRSEQChartValue)

Draw one bar of the equalizer chart depending on the   Style

protected method

DrawEQBar(TCanvas,TCanvasRect,TCanvasRect,TRSChartValueType,TCanvasColor,Single)

Draw one equalizer bar with the classic equalizer style of it being broken up into smaller bars, specified by the Subdivisions

protected method

DrawHighMark(TCanvas,TCanvasRect,TCanvasRect,TRSChartValueType)

Draw the high mark for the value

protected method

Drawing(TCanvas,TCanvasRect)

Calls the OnDrawing event and returns True if the draw process should continue.

This method is called before the InternalDraw method.

public method

DrawLabel(TCanvas,String,TCanvasPixel,TCanvasPixel,Single)

Overloaded. Draws the text caption centered above the X, Y point without clipping.

noteNote

The Opacity is ignored in VCL

public method

DrawLabel(TCanvas,String,TCanvasRect,Single)

Overloaded. Draws the text caption centered within the rectangle. The text is clipped

noteNote

The Opacity is ignored in VCL

public method

DrawLabel(TCanvas,TRSChartValue,TCanvasPixel,TCanvasPixel)

Overloaded. Draws the text caption centered above the X, Y point without clipping.

noteNote

The Opacity is specified by the RSChartPanel.TRSChartValue.Opacity property

public method

DrawLabel(TCanvas,TRSChartValue,TCanvasRect)

Overloaded.  Draws a label for the TRSChartValue on the canvas. The text of the label is controlled by the ValueLabelStyle property.

The label is drawn within the specified rectangle.

noteNote

The Opacity is specified by the RSChartPanel.TRSChartValue.Opacity property

protected method

Drawn(TCanvas,TCanvasRect)

Calls the OnDraw event.

This method is called after the InternalDraw method.

public method

EndUpdate

Re-enables screen repainting and change events. Use EndUpdate to re-enable screen repainting and change events that were turned off with the BeginUpdate method. (Inherited from RSChartPanel.TRSCustomChart.)

public method

FormatValue(TRSChartValue,TRSLabelTextStyle)

Generates a label for the Value based on the TextStyle (Inherited from RSChartPanel.TRSCustomChart.)

public method

GetAdjOffsetVertical

Returns the vertical offset (     OffsetVertical).

If coUseVerticalOffset is not in     Options, this method always returns 0. If coUseVerticalOffset is in Options, the function returns the OffsetVertical value.

public method

GetAdjOrigin

Represents method GetAdjOrigin.

public method

GetAxisCaption(TRSChartAxis,Integer,TRSChartValueType)

Returns a label for an axis ( RSChartPanel.TRSChartAxis ) based on the input Value. The Index specifies where to start looking in the chart Values (for optimization purposes) and decrements from there until the closest chart value is found. (Overrides RSChartPanel.TRSCustomChart.GetAxisCaption(TRSChartAxis,Integer,TRSChartValueType).)

public methodClass member

GetChartType

Returns the chart type enumerated value for this class. Each chart class overrides this class function to return the RSChartConsts|TRSChartType enumerated value (Overrides RSChartPanel.TRSCustomChart.GetChartType.)

protected method

GetColor

Overloaded. Represents method GetColor. (Inherited from RSChartPanel.TRSCustomChart.)

public method

GetColor(TRSChartValue)

Overloaded. Returns the color of the chart value. The color of the TRSChartValue can change depending on the   Options property as well as any other chart states (e.g., the TRSCandleStickChart class overrides this method to turn the color red or green depending on if the Open value is greater than the Closing Value) (Inherited from RSChartPanel.TRSCustomChart.)

public method

GetCumulativeTotal(Integer,Integer,TRSCustomChartClass)

Determine the cumulative value at this index for all charts in the Group. The ValIndex specifies the     TRSChartValue.Values dimension to compare.

Used for stacking charts.

public method

GetCumulativeValue(Integer,Integer,TRSCustomChartClass)

Determine the cumulative value at this index for all charts below (spatially) this chart in the same     Group. The ValIndex specifies the     TRSChartValue.Values dimension to compare.

Used for stacking charts.

protected method

GetGroupDimension

Represents method GetGroupDimension. (Overrides RSChartPanel.TRSCustomChart.GetGroupDimension.)

protected method

InitializeChangeEvents

Initialize the OnChange events of structures. Use this method to assign event handlers for structures (e.g., Pen.OnChange := MyChangeMethod).

alert_noteNotes to Inheritors

The constructor calls this method after it calls the InitializeChart method, which is where the structures should be actually created and initialized.

protected method

InitializeChart

Creates and initialize structures and values of chart. This method is the safe place to initialize chart values without change events occurring.

alert_noteNotes to Inheritors

The constructor calls this method. Use this method to actually create and initialize properties. Do not assign event properties in this method (use the InitializeChangeEvents method instead)

protected method

InternalDraw(TCanvas,TCanvasRect)

Overloaded.  Paints the chart graphic to the specified canvas at the specified rectangle. The InternalDraw method is called by the     Draw method.

Descendant classes of TRSCustomChart override the InternalDraw method to actually paint themselves.

alert_noteNotes to Inheritors

The default InternalDraw method implementation assigns the     Brush, Pen , and Font to the Canvas.

protected method

InternalSelect(TCanvasRect,TRSChartSelectionAction)

Selects or deselects chart Values ( RSChartPanel.TRSChartValue ) based on whether they intersect with the selection rectangle (which is in pixel coordinates).

The base method converts the SelectionRect to chart coordinates (based on     HorizontalAxis and     VerticalAxis) and then selects values based on the TRSChartValue.Selectable method

public method

IsSelectable(TCanvasRect)

Returns True if any value in the chart intersects with the SelectionRect (Inherited from RSChartPanel.TRSCustomChart.)

protected method

IsValuesStored

Represents method IsValuesStored. (Inherited from RSChartPanel.TRSCustomChart.)

public method

IsVisible

Indicates whether the chart is visible. A chart is visible if its Visible property is True and both axes have been assigned. (Inherited from RSChartPanel.TRSCustomChart.)

protected method

Loaded

Represents method Loaded. (Inherited from RSChartPanel.TRSCustomChart.)

protected method

MouseHover(TCanvasRect)

Represents method MouseHover(TCanvasRect). (Inherited from RSChartPanel.TRSCustomChart.)

protected method

Notification(TComponent,TOperation)

Represents method Notification(TComponent,TOperation). (Inherited from RSChartPanel.TRSCustomChart.)

protected method

Paint

Represents method Paint. (Inherited from RSChartPanel.TRSCustomChart.)

protected method

PanelChanged

Represents method PanelChanged. (Inherited from RSChartPanel.TRSCustomChart.)

public method

Select(TCanvasRect,TRSChartSelectionAction)

Selects or deselects chart Values ( RSChartPanel.TRSChartValue ) based on whether they intersect with the selection rectangle (which is in pixel coordinates).

The base method converts the SelectionRect to chart coordinates (based on     HorizontalAxis and     VerticalAxis) and then selects values based on the TRSChartValue.Selectable method

alert_noteNotes to Inheritors

Descendant classes override the InternalSelect method

protected method

SelectionColorChanged

Represents method SelectionColorChanged. (Inherited from RSChartPanel.TRSCustomChart.)

protected method

SenderChanged(TObject)

Overloaded. Represents method SenderChanged(TObject). (Inherited from RSChartPanel.TRSCustomChart.)

protected method

SetCanvasResources(TCanvas,TRSChartValue)

Represents method SetCanvasResources(TCanvas,TRSChartValue). (Inherited from RSChartPanel.TRSCustomChart.)

protected method

SetColor(TCanvasColor)

Represents method SetColor(TCanvasColor). (Inherited from RSChartPanel.TRSCustomChart.)

protected method

SetOptions(TChartOptions)

Represents method SetOptions(TChartOptions). (Inherited from RSChartPanel.TRSCustomChart.)

protected method

UpdateAxisInfo(TRSChartAxis)

Represents method UpdateAxisInfo(TRSChartAxis). (Overrides RSChartPanel.TRSCustomChart.UpdateAxisInfo(TRSChartAxis).)

protected method

ValueSelectionChanged(TRSChartValue)

Represents method ValueSelectionChanged(TRSChartValue). (Inherited from RSChartPanel.TRSCustomChart.)

protected method

ValueVisibleChanged(TRSChartValue)

Represents method ValueVisibleChanged(TRSChartValue). (Inherited from RSChartPanel.TRSCustomChart.)

protected method

VisibleChanged

Represents method VisibleChanged. (Inherited from RSChartPanel.TRSCustomChart.)

protected method

WantsCaptions(TRSChartAxis)

Returns true if the chart prefers Captions over Values for its labels on the input Axis. This method provides a hint to the TRSChartAxis when LabelStyle is alsAutomatic. (Overrides RSChartPanel.TRSCustomChart.WantsCaptions(TRSChartAxis).)

Top

expandingFields


Name

Description

protected field

FFirstIndex

Represents field FFirstIndex. (Inherited from RSChartPanel.TRSCustomChart.)

protected field

FInPaintTo

Represents field FInPaintTo. (Inherited from RSChartPanel.TRSCustomChart.)

protected field

FLastIndex

Represents field FLastIndex. (Inherited from RSChartPanel.TRSCustomChart.)

protected field

FOptions

Represents field FOptions. (Inherited from RSChartPanel.TRSCustomChart.)

protected field

FSuppressAxesChange

Represents field FSuppressAxesChange. (Inherited from RSChartPanel.TRSCustomChart.)

protected field

FUpdating

Represents field FUpdating. (Inherited from RSChartPanel.TRSCustomChart.)

protected field

FVisibleCount

Represents field FVisibleCount. (Inherited from RSChartPanel.TRSCustomChart.)

Top

expandingExamples

To display a chart, you drop the component on a form and optionally connect its Panel property to the RSChartPanel|TRSChartPanel component where you want it to be displayed. The Values property is the most important property of the chart type and allows you to define the chart values at design-time or run-time. For the EQ Chart, the Values property contains TRSEQChartValue collection items which define the Value or Height of the Bar and its High water mark.
 

To display a equalizer chart inside a chart panel:
 

Drop a TRSEQChart component on a form
Drop a TRSChartPanel component where you want the chart to be displayed. (Note, more than one chart can share the same chart panel)
Connect the Panel property of the chart to the chart panel

To add a equalizer bar to the chart (at Design-Time):

Select the TRSEQChart component
 
Click the ellipsis button (...) for the Values property of the chart. This action displays Delphi's Collection Editor for the TRSEQChartValues collection.
Use the Add button to add equalizer bars (TRSEQChartValue collection item) to the chart.
 
Edit the Value property for the height of the bar (or the width, depending on Orientation)
Optionally, edit the High property for the maximum previous height of the bar
 

To add a equalizer bar to the chart (at Run-Time):

Delphi

var
   Value: TRSEQChartValue;  // note, this type should be the same that the chart uses (e.g., TRS2DChartValue, TRSArrowChartValue, etc)
 begin
   // Add bar
   Value := MyChart.Values.Add;
   Value.Color := clRed;
   Value.Value := 10.0;
   Value.High := 15.3;
 end;

expandingSee Also

Comments (0)

RiverSoftAVG Charting Component Suite (RCCS) © 2005-2015, Thomas G. Grubb